
Florida continues to be a national leader on college-caliber Advanced Placement exams, fueled by the success of growing numbers of low-income students.
The Sunshine State ranks No. 4 in the nation in the percentage of graduating seniors who have passed at least one AP exam, according to 2016 data released in a new report from the College Board, the nonprofit that administers the AP program.
At 29.5 percent, Florida outpaces the national average of 21.9 percent and trails only Massachusetts, Maryland and Connecticut, states with far fewer low-income students and far better academic reputations.
AP exams are standardized tests that correspond with dozens of college-caliber high school courses. They are widely viewed as a good gauge of a student’s college readiness and, in some credible quarters, as a good indicator of a state’s educational quality.
The latest results aren’t a fluke. The percentage of graduating seniors passing AP exams in Florida shot up 11 percentage points between 2006 and 2016, putting the state No. 3 in progress over that span. In raw numbers, 47,242 graduating seniors from the class of 2016 had passed at least one, nearly double the number from a decade ago.
Florida’s outcomes are even more impressive given its demographics. Florida has the highest rate of students eligible for free- and reduced-price lunch among states in the AP Top 10, and in most cases, a far higher rate. No state has a bigger differential between the relative poverty of its student body and its overall performance on AP exams. (See chart at the bottom of the post.)
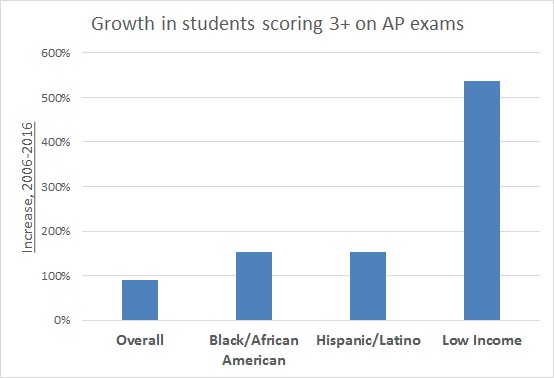
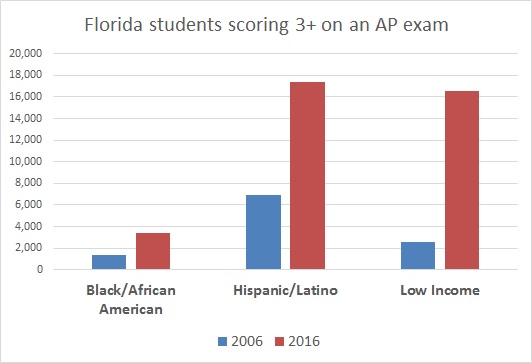
Additional AP numbers from the Florida Department of Education show low-income students are leading the charge. The percentage of low-income graduating seniors who passed an AP exam climbed more than 500 percent between 2006 and 2016, and that group made up more than 60 percent of the total growth in AP-passing graduates, according to DOE figures.
The Sunshine State can trace its AP rise to the late 1990s, when state leaders decided to open AP doors to more low-income and minority students. Equity, higher expectations and targeted funding helped guide their strategy.
“Non-traditional” AP students were given more academic support in middle school, and the state paid their exam fees (now $93 a pop). AP teachers, meanwhile, were given more professional development to handle more diverse, and sometimes more challenging, classrooms.
To be sure, there are gaps in Florida’s progress. The state does not have as high a percentage of students scoring at the highest levels of AP as any of the other Top 10 states (see p. 16 of the College Board report). And the results are not nearly as good in AP math and science, which some expert observers are right to note.
| State AP performance vs. FRL rank | |||||
| State | AP success rank | AP success rate | FRL rank | FRL % | AP-FRL gap |
| Massachusetts | 1 | 31.0% | 7 | 38.3 | 6 |
| Maryland | 2 | 30.4% | 19 | 44.2 | 17 |
| Connecticut | 3 | 30.1% | 4 | 37.1 | 1 |
| Florida | 4 | 29.5% | 42 | 58.4 | 38 |
| California | 5 | 28.5% | 40 | 58.1 | 35 |
| Virginia | 6 | 28.3% | 12 | 39.7 | 6 |
| New York | 7 | 27.3% | 32 | 50.2 | 25 |
| Colorado | 8 | 26.9% | 15 | 42 | 7 |
| New Jersey | 9 | 26.5% | 6 | 38 | -3 |
| Illinois | 10 | 25.1% | 33 | 51.4 | 23 |
| Wisconson | 11 | 24.8% | 14 | 41.9 | 3 |
| Vermont | 12 | 24.4% | 9 | 39.4 | -3 |
| Utah | 13 | 24.3% | 3 | 37 | -10 |
| Nevada | 14 | 22.5% | 34 | 53.1 | 20 |
| Washington | 15 | 22.5% | 23 | 46.3 | 8 |
| Georgia | 16 | 22.4% | 47 | 62.1 | 31 |
| Minnesota | 17 | 22.3% | 8 | 38.4 | -9 |
| Maine | 18 | 21.3% | 22 | 45.8 | 4 |
| North Carolina | 19 | 20.6% | 37 | 54 | 18 |
| Texas | 20 | 20.2% | 44 | 60.1 | 24 |
| New Hampshire | 21 | 20.1% | 1 | 27.8 | -20 |
| Michigan | 22 | 19.9% | 27 | 48.3 | 5 |
| Deleware | 23 | 18.7% | 12 | 39.7 | -11 |
| South Carolina | 24 | 18.7% | 39 | 57.4 | 15 |
| Rhode Island | 25 | 18.6% | 24 | 46.8 | -1 |
| Pennsylvania | 26 | 18.2% | 18 | 43.6 | -8 |
| Indiana | 27 | 18.1% | 28 | 49.2 | 1 |
| Kentucky | 28 | 17.6% | 38 | 54.8 | 10 |
| Oregon | 29 | 17.5% | 36 | 53.5 | 7 |
| Arkansas | 30 | 17.0% | 45 | 61.2 | 15 |
| Ohio | 31 | 16.9% | 20 | 44.6 | -11 |
| Alaska | 32 | 16.5% | 17 | 43 | -15 |
| Arizona | 33 | 15.6% | 35 | 53.4 | 2 |
| Hawaii | 34 | 15.5% | 30 | 50.5 | -4 |
| Iowa | 35 | 13.0% | 13 | 40.9 | -22 |
| South Dakota | 36 | 12.9% | 10 | 39.6 | -26 |
| Alabama | 37 | 12.8% | 42 | 58.4 | 5 |
| Montana | 38 | 12.8% | 16 | 42.1 | -22 |
| New Mexico | 39 | 12.3% | 49 | 67.2 | 10 |
| Idaho | 40 | 12.1% | 25 | 47.4 | -15 |
| Tennessee | 41 | 11.9% | 43 | 58.8 | 2 |
| Oklahoma | 42 | 11.7% | 46 | 61.9 | 4 |
| Wyoming | 43 | 11.7% | 5 | 37.7 | -38 |
| Missouri | 44 | 11.4% | 29 | 49.7 | -15 |
| West Virginia | 45 | 10.9% | 26 | 47.9 | -19 |
| Kansas | 46 | 10.7% | 31 | 50.1 | -15 |
| Nebraska | 47 | 10.6% | 21 | 44.9 | -26 |
| North Dakota | 48 | 9.6% | 2 | 30.2 | -46 |
| Louisiana | 49 | 7.8% | 48 | 66.8 | -1 |
| Mississippi | 50 | 5.9% | 50 | 72.2 | 0 |
| NATIONAL | 21.9% | 52 | |||
| Sources: AP Cohort Data Report Graduating Class of 2016; National Center for Education Statistics | |||||