

Routinely underappreciated, Florida’s K-12 schools do outstanding work with what they are given. Despite a relatively large low-income/working-class majority-minority student population and low per-pupil funding compared to other states, Florida performs about middle of the pack on national assessments.
Results look even better when making apples-to-apples comparisons, which include controlling for racial and income differences between states. Unfortunately, that good news is often ignored by many professing anxiety over education quality in the Sunshine State.
The latest concern over the quality focuses on college readiness, specifically SAT scores, and suffers from a flawed apples-to-oranges comparison.
According to the College Board, just 35 percent of Florida’s high school seniors were “college ready” on both the English and math portions of the exam. Florida’s college readiness rate is in the bottom half of all states, but the College Board warns against making comparisons:
“Relationships between test scores and other background or contextual factors are complex and interdependent. Caution is warranted when using scores to compare or evaluate teachers, schools, districts or states because of differences in participation and test taker populations.”
Comparing SAT proficiency rates is problematic because the tests are voluntarily taken by high school students. This creates a selection bias problem where students who are most likely to be ready for college are also the most likely to take the SAT. Comparing Florida, where 97 percent of high school seniors took the SAT, to a state like North Dakota, where only 2 percent of students took the test, would be completely unfair, as Florida’s test-takers include students who have no intention of going to college.
Even comparing the 10 states with 90 percent or better participation rates is problematic because of significant differences in the student populations.
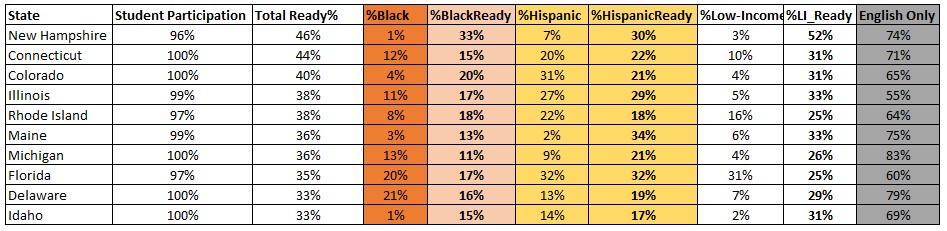
Of those 10 states, Florida placed eighth with 35 percent of its students receiving a college-ready score on both the reading and math portions of the SAT. Florida beats only Delaware and Idaho, but is in striking distance of several other states.
Florida is the also ONLY majority-minority state in the group. Two states — New Hampshire and Maine — are more than 90 percent white.
Additionally, 31 percent of test-takers in Florida received a “Fee Waiver,” meaning they were considered low-income enough to take the exam for free. Rhode Island has the second-highest low-income participation rate at just 16 percent and is the ONLY other state with more than 10 percent poverty on the list.
Florida also has the highest percentage of Hispanic students take the test, and only Delaware has a higher percentage of black test-takers.
In other words, the other states in the comparison group are whiter and wealthier, on average.
When looking at the racial breakdowns, Florida ties for fourth place for college readiness for black students (17 percent) and second place for Hispanic students (32 percent).
State-by-state comparisons on SAT scores is problematic for a host of reasons. No conclusion can be drawn other than all states have a lot of work to do, especially for low-income and minority students.

[…] Patrick Gibbons’s recent defense of the state’s SAT results on redefinedonline.org provides a frustrating example of this defense of mathematical mediocrity at the middle and high school levels. Patrick starts by arguing that instead of comparing Florida’s SAT results to all states, our results should only be compared with nine other states where more than 95% of high school graduates take the SAT. I agree. So below, I show results from the Gibbons Ten – the ten states with SAT-taking rates higher than 95% – for the 2017 NAEP 4th grade math exam, the 2017 NAEP 8th grade math exam, and the 2018 SAT math exam. The metric Patrick discussed was the percentage of students from a state earning a high enough SAT math score to be considered “college-ready” by the College Board (for Florida that was 37%). So I choose to show the closest NAEP metric to that – the percentage of students who are deemed either “proficient” or “advanced”. And I show that metric for 4th grade and 8th grade. […]