
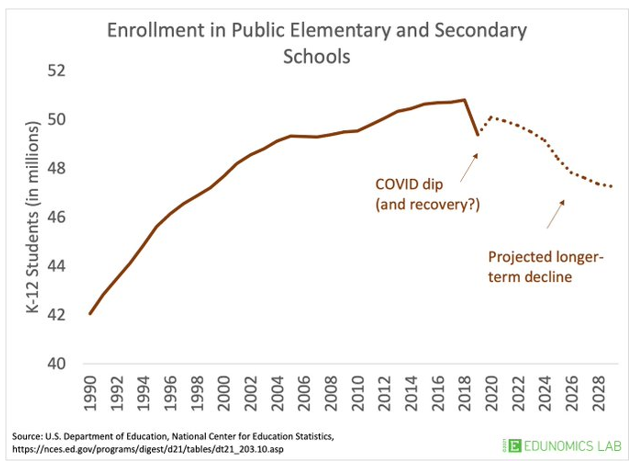
 In the fall of 2019, American public-school enrollment stood at 50,796,445 students, as it turned out, a peak likely not to be revisited in our lifetimes.
Between a baby-bust that commenced in 2007 (with a COVID-19 accelerant), a declared forever-culture war over curriculum, pension costs strangling the hiring of new teachers, and a myriad of other challenges, some self-inflicted, the writing is on the wall.
The National Center for Education Statistics projected public school enrollment declines by state for the 2021-30 period:
| Table 1: Public School Enrollment Projections by State, 2022 to 2030 (Source: National Center for Education Statistics) | ||||||
| Fall 2022 | Fall 2023 | Fall 2024 | Fall 2025 | Fall 2030 | Trend | |
| Alabama | 753,900 | 756,100 | 757,500 | 755,600 | 740,400 | -1.8% |
| Alaska | 133,100 | 133,400 | 133,400 | 133,100 | 128,500 | -3.5% |
| Arizona | 1,144,400 | 1,149,100 | 1,152,300 | 1,152,400 | 1,155,000 | 0.9% |
| Arkansas | 497,600 | 498,700 | 499,600 | 497,500 | 487,700 | -2.0% |
| California | 6,005,300 | 5,934,900 | 5,854,800 | 5,786,200 | 5,425,900 | -9.6% |
| Colorado | 883,200 | 875,800 | 867,100 | 857,300 | 817,300 | -7.5% |
| Connecticut | 512,300 | 509,100 | 505,400 | 500,500 | 475,600 | -7.2% |
| Delaware | 141,500 | 141,900 | 142,300 | 142,100 | 137,600 | -2.8% |
| DC | 98,000 | 98,900 | 99,500 | 99,300 | 94,700 | -3.4% |
| Florida | 2,814,600 | 2,806,000 | 2,791,000 | 2,775,800 | 2,704,600 | -3.9% |
| Georgia | 1,738,100 | 1,723,000 | 1,707,200 | 1,686,600 | 1,606,600 | -7.6% |
| Hawaii | 177,200 | 175,000 | 173,200 | 170,900 | 158,900 | -10.3% |
| Idaho | 314,300 | 315,000 | 315,400 | 314,700 | 312,000 | -0.7% |
| Illinois | 1,924,000 | 1,919,600 | 1,914,100 | 1,897,500 | 1,800,900 | -6.4% |
| Indiana | 1,051,400 | 1,052,100 | 1,050,300 | 1,045,600 | 1,017,800 | -3.2% |
| Iowa | 521,500 | 521,700 | 520,700 | 518,300 | 505,900 | -3.0% |
| Kansas | 484,500 | 480,700 | 476,200 | 470,300 | 440,300 | -9.1% |
| Kentucky | 665,700 | 661,800 | 657,500 | 650,900 | 626,500 | -5.9% |
| Louisiana | 705,000 | 702,100 | 699,600 | 694,600 | 671,700 | -4.7% |
| Maine | 173,000 | 171,600 | 170,300 | 168,700 | 161,800 | -6.5% |
| Maryland | 903,100 | 902,100 | 900,800 | 895,800 | 859,700 | -4.8% |
| Massachusetts | 927,200 | 923,200 | 920,100 | 913,700 | 879,900 | -5.1% |
| Michigan | 1,427,600 | 1,418,900 | 1,409,200 | 1,395,800 | 1,329,900 | -6.8% |
| Minnesota | 902,200 | 908,300 | 912,800 | 913,100 | 903,100 | 0.1% |
| Mississippi | 429,800 | 420,800 | 412,000 | 401,500 | 364,700 | -15.1% |
| Missouri | 882,700 | 873,100 | 862,100 | 848,500 | 792,200 | -10.3% |
| Montana | 147,400 | 146,600 | 145,200 | 143,700 | 136,800 | -7.2% |
| Nebraska | 334,400 | 334,900 | 335,100 | 336,100 | 329,200 | -1.6% |
| Nevada | 494,300 | 494,000 | 492,400 | 489,400 | 476,300 | -3.6% |
| New Hampshire | 165,900 | 163,200 | 160,500 | 157,600 | 144,600 | -12.8% |
| New Jersey | 1,393,000 | 1,388,200 | 1,382,300 | 1,372,000 | 1,307,600 | -6.1% |
| New Mexico | 311,400 | 305,200 | 299,100 | 292,100 | 263,700 | -15.3% |
| New York | 2,613,000 | 2,592,700 | 2,573,000 | 2,547,000 | 2,399,100 | -8.2% |
| N. Carolina | 1,545,000 | 1,545,600 | 1,545,400 | 1,541,500 | 1,524,800 | -1.3% |
| N. Dakota | 120,400 | 121,700 | 122,600 | 123,000 | 123,500 | 2.6% |
| Ohio | 1,670,300 | 1,669,400 | 1,666,100 | 1,657,500 | 1,599,400 | -4.2% |
| Oklahoma | 717,300 | 719,600 | 719,200 | 715,900 | 692,900 | -3.4% |
| Oregon | 584,300 | 581,900 | 577,800 | 571,700 | 538,900 | -7.8% |
| Pennsylvania | 1,712,900 | 1,710,100 | 1,705,200 | 1,694,800 | 1,626,600 | -5.0% |
| Rhode Island | 139,500 | 138,400 | 137,500 | 136,000 | 130,200 | -6.7% |
| S. Carolina | 790,300 | 792,100 | 792,400 | 789,300 | 772,200 | -2.3% |
| S. Dakota | 145,500 | 146,700 | 147,200 | 147,200 | 145,800 | 0.2% |
| Tennessee | 1,014,100 | 1,018,800 | 1,022,000 | 1,023,300 | 1,029,900 | 1.6% |
| Texas | 5,495,100 | 5,481,200 | 5,469,300 | 5,442,300 | 5,311,300 | -3.3% |
| Utah | 710,700 | 718,700 | 724,600 | 727,900 | 742,900 | 4.5% |
| Vermont | 83,600 | 82,500 | 81,500 | 80,300 | 74,600 | -10.8% |
| Virginia | 1,254,300 | 1,243,900 | 1,235,200 | 1,224,000 | 1,177,500 | -6.1% |
| Washington | 1,096,900 | 1,092,700 | 1,086,600 | 1,077,200 | 1,033,500 | -5.8% |
| West Virginia | 249,100 | 243,400 | 237,600 | 231,000 | 202,400 | -18.7% |
| Wisconsin | 840,500 | 835,400 | 829,100 | 820,200 | 780,200 | -7.2% |
Note that Table 1 is public school enrollment, not district enrollment. District enrollment may fare even worse. American public-school enrollment grew for 30 years after 1990; adjusting to the new reality won’t be easy.
 The history of shrinking state enrollments in the past would indicate that the most likely outcome will be to simply spend more per pupil. It worked in the past:
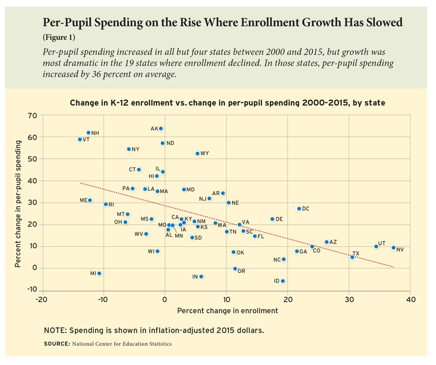
Note, however, that the 2000-15 period included a great number of baby boomers in their prime earning years. Between now and 2030, an average of 10,000 baby boomers per day will reach the age of 65. In other words, the feather-pillow soft landing in the chart above won’t be available in the future.
What then to do?
Many districts will either close a number of schools between now and 2030 or they will financially hamstring themselves keeping low-enrollment schools open. School boards have not exactly covered themselves in glory dealing with under-utilized school space to date, and the issue will become increasingly urgent. Some innovative approaches may be needed.
Herding students by ZIP code to often poorly managed schools with extremely limited incentives for performance will linger as a distastefully antiquated practice. Peonage and killing whales for oil after we could get it out of the ground persisted for decades despite being repulsive.
The opponents of self-determination in education should realize that regardless of what they do, the status-quo is not remotely an option. Even if it were, it would not be a desirable one.

[…] This article originally appeared at reimaginED. […]