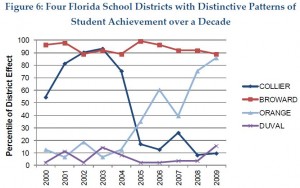
It shouldn’t be a secret that some Florida school districts perform better than others, despite more challenging demographics. Yet for years, it’s been a fact hidden in plain sight. Now, though, a leading think tank is giving the Legislature and the Florida Board of Education a compelling reason to take a closer look.
 A new study from the Brookings Institution, released this morning, relays what FCAT data has been trying to tell us. Some Florida districts are chugging ahead despite a heavier load of high-poverty kids, while some with lighter loads lag. Some are making sustained gains relative to the pack, while others progress in fits and starts. The differences are puzzling, fascinating and, if you happen to live in an underperforming district, maddening. Yet they’ve been given scant attention by researchers, reporters, policy makers and advocacy groups.
Stepping into the vacuum, Brookings’ Brown Center on Education Policy analyzed a decade’s worth of test data for fourth- and fifth-graders in Florida and North Carolina. It controlled for race, income and other variables. And it came away with two findings: 1) School districts account for only a small percentage of the total variation in student achievement – 1 to 2 percent. (Teachers account for about 7 percent). But 2) the differences between districts are still so great that by the end of the school year, a kid in a higher-performing district can be nine weeks ahead – a quarter of a school year ahead – of a like student in a lower-performing district. Over time, the accumulated deficits would obviously be staggering.
“We suggest that a variable that can potentially increase productivity by 25% is important,” the researchers wrote. “These are differences that are large enough to warrant policy attention.”
It’s not just Florida and North Carolina that should be crunching more numbers. As the report notes, there are roughly 14,000 school districts nationwide. In this age of accountability and choice, parents routinely compare schools, and all kinds of think tanks compare states. But districts? Not so much.
The Brookings researchers pointed to districts that showed distinctive patterns relative to other districts – they were either consistently high performing, consistently low performing, dramatically rising or dramatically tanking. In Florida, the districts that fit that bill were Broward, Duval, Orange and Collier, respectively. These districts weren’t necessarily the ones that made the most pronounced pattern in each category. And the researchers offered a number of cautionary caveats, including, again, that they only looked at data for two grades, and that comparisons were made “relative to their demographic odds” – not to a set standard like FCAT pass rates.
But still, the trend lines punctuate the point: District performance deserves a spotlight.
I know from my own looks at FCAT data that the Miami-Dade district has gotten traction with low-income students, while Pinellas does particularly poorly with black students. What are these districts doing, or not doing, that makes the difference? Drilling into the data can begin to unearth lessons. Here’s what I wrote back in October, after the state quietly released its latest batch of FCAT demographic data:
Even with state mandates, districts have considerable leeway. Taking a closer look at achievement data district by district would spark more discussion about which ones are employing policies and programs that make the biggest difference for kids. The variation is endless. Some districts put more disability labels on minority students. Some put a premium on career academies. Some focus on principal development. Some have stronger superintendents. Some face more competition from charter schools and tax credit scholarships. How do things like that factor into district-to-district gaps? I’m sure it’s difficult to sort one from another, and impossible to draw definitive conclusions. But we won’t develop better hunches without looking at the data and talking about it.
The Brookings researchers called their findings a “tantalizing fruit for those who want to better understand why some districts are better than others and translate that knowledge into action.” In realms beyond education, they wrote, there’s no question such differences would be scoured for clues and tips:
If we found such differential patterns of effectiveness in the context of industrial production or sports team win/loss records or chain store sales or hospital readmission rates we would think that surely it would be possible to find out what accounts for them. And we would reasonably assume that knowledge of why one plant or team or store or hospital does better than others would lead to interventions that would successfully bring up the low performers. The same logic model applies to differences in the effectiveness of school districts.
What are we waiting for?


[…] Reading: ReDefined, Mar […]