![]() Making use of data from the Educational Opportunity Project at Stanford University, the Fordham Institute has produced a new study of metropolitan area academic achievement. Fordham finds that increased charter school market share is associated with statistically significantly higher scores for disadvantaged student populations.
Making use of data from the Educational Opportunity Project at Stanford University, the Fordham Institute has produced a new study of metropolitan area academic achievement. Fordham finds that increased charter school market share is associated with statistically significantly higher scores for disadvantaged student populations.
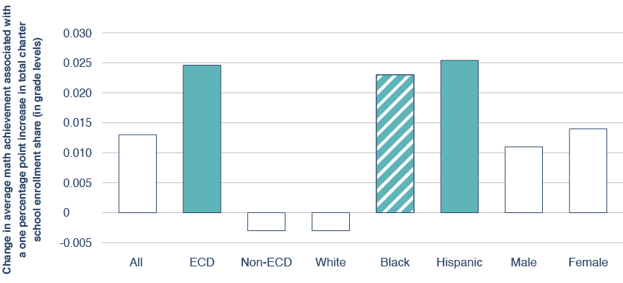
The chart below shows differences for math achievement for economically disadvantaged and Hispanic students as significant at the .05 level, and the difference for Black students significant at the .1 level.
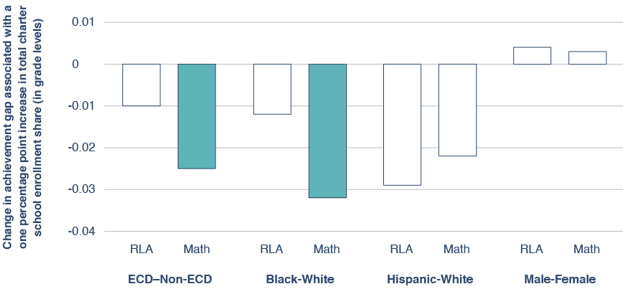
The study also found evidence of narrowing achievement gaps in metropolitan areas with larger charter school shares in math, as evidenced below.
The Fordham findings are consistent with a great many studies that have found positive competitive effects associated with choice programs. The benefits are not limited to charter schools. Similar findings have been found with regard to private choice, and for areas with higher levels of choice between district schools.
Choice programs, rather than existing in silos, interact with each other. Charter and private choice programs create incentives for districts to open their doors for open enrollment. Once one district lowers the open enrollment drawbridge, nearby districts feel an increased pressure to follow-suit, and the competitive juices begin to flow.
 In a classic bit in his comedy special “Delirious,” Eddie Murphy comments on how strange it is that people hang around in haunted houses in movies like “The Amityville Horror”:
“I would have been in the house and said, ‘Baby, this is beautiful! We got a chandelier hanging here, kids outside playing, it’s a beautiful neighborhood, I really love this, this is really nice …”
An unseen demonic voice urges, “Get out!!!”
“It’s too bad we can’t stay!”
An increasing number of American families have adopted the attitude that the nation’s public-school system is a sunk cost and have made alternative plans to ensure the future of their children. Home-schooling is at an all-time high, micro-school pods have exploded, and lawmakers are busily and wisely expanding parental choice programs.
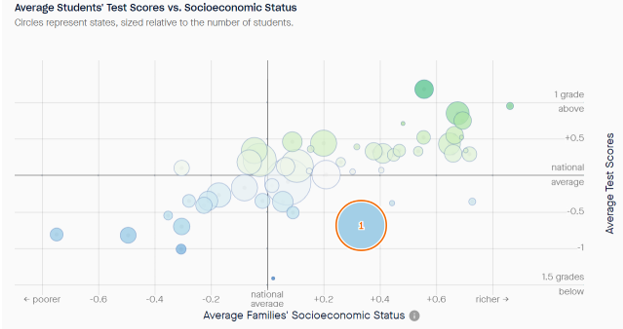
In the chart below, the Educational Opportunity Project at Stanford University marks the nation’s largest state, California, as 1. The median home value in California in September 2021 was $808,890, which would assure your children a spot in a public-school system that is well below average in terms of academic outcomes.
Is it any wonder that Silicon Valley invented pandemic pods?
If you’re wondering how it’s possible for a state to be so wealthy and inept, a Riverside, Calif., student recently did all of us a favor by filming a Trigonometry class; the clip went viral. The district placed the teacher on paid leave for the cultural insensitivity of whatever it was she was doing.
Mere pedagogical incompetence, however, remains beyond the reach of a school board to address, as the reader can clearly see from the chart.
The eggs of far too many public schools have begun frying themselves, and the fridge is strangely growling out, "ZUUL!"
If you are confused as to what to do, just remember “WWEMD,” or “What Would Eddie Murphy Do?”
 The Wall Street Journal recently reported that at the close of the 2020-21 academic year, women comprised 59.5% of college students, an all-time high. Men, at 40.5%, were at an all-time low, according to enrollment data from the National Student Clearinghouse. The Journal also reported that U.S. colleges and universities had 1.5 million fewer students compared with five years earlier, with men accounting for 71% of the decline.
Does the K-12 system bear some of the blame for this? The Educational Opportunity Project at Stanford University has data that will allow you to judge for yourself.
This graph shows data the Project collected on academic growth in grades 3-8 between 2008 and 2018 presented by state. The rate of academic growth for American students generally is low compared to other advanced countries. You certainly want to be above the horizontal line. For the most part, female students were showing above average levels of academic growth during the period covered.
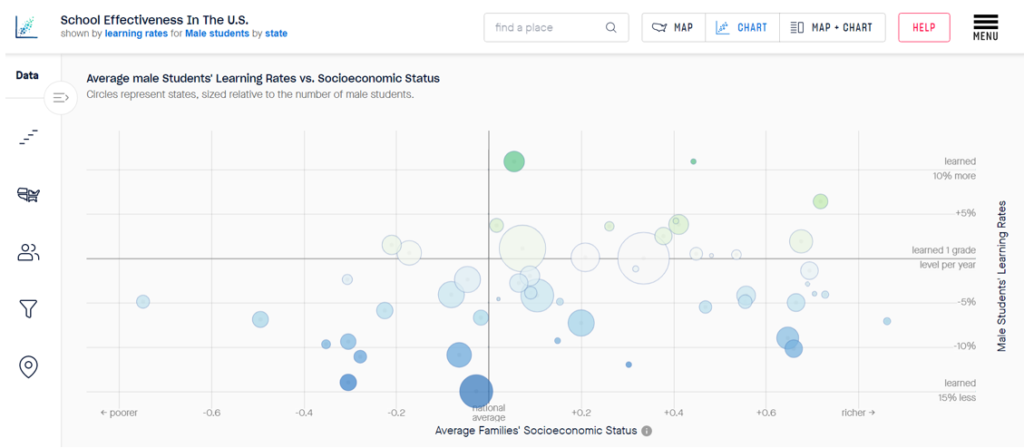
When examining the rates for boys in this next chart, the desired dark green dots get much scarcer, while the dreaded blue and dark-blue dots appear.
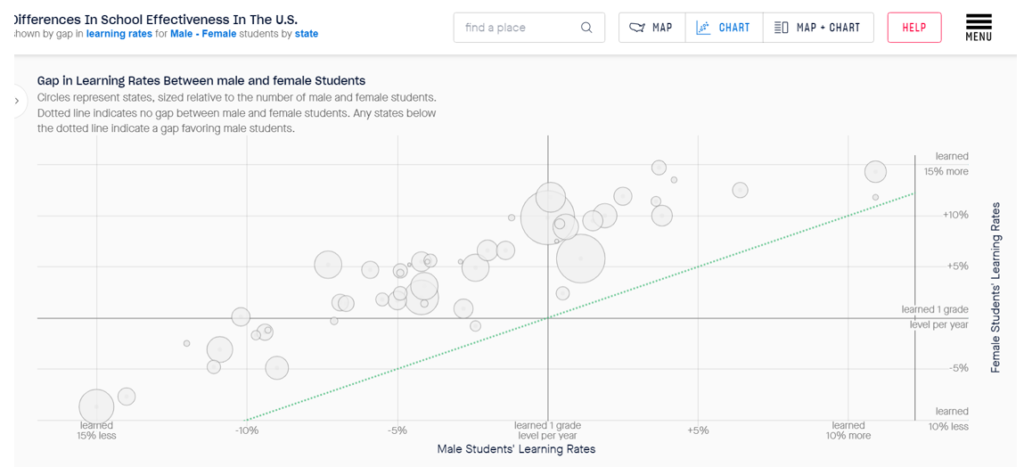
The Stanford website also allows you to compare gaps in growth rates. This graph shows that in every single state, the rate of academic growth for girls exceeded those of boys. The issue appears to be a far cry from being random.
Mind you that all this data was gathered before the COVID-19 disaster.
ZIP-code assignment into a system of largely non-specialized schools bound and determined to maximize non-teaching employment for adults isn’t working out for boys. Having these schools go through the motions of being held “accountable” so as to avoid being put on double secret probation appears ineffectual, or perhaps even counterproductive.
It’s unclear the extent to which the K-12 status-quo is either the problem or part of the problem, but the second chart makes it abundantly clear that it is not much of a solution. It’s time for new approaches and school models.

A student at New Orleans Charter Science and Math High School – “Sci High” – shows off the ingredients that earned her a win at the Louisiana Science and Engineering Fair earlier this month.
The Educational Opportunity Project at Stanford University released new data recently, covering the years 2007 to 2018. Opportunity Project scholars linked state achievement exams in grades 3-8 across the country to allow comparisons.
Arizona – the state with the nation’s largest charter school sector, a very active open-enrollment market and private choice programs to boot – demonstrated the highest overall level of academic growth among states, for students overall as well as for low-income students.
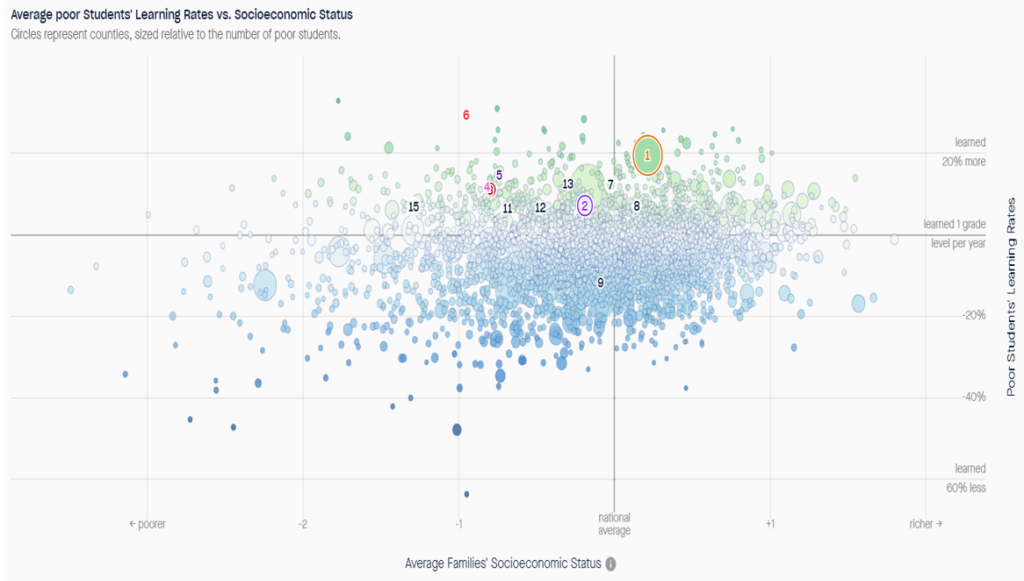
The Opportunity Project’s data explorer has a nifty visualization tool that makes charts like the one above. This one shows the rate of academic growth by county for poor children in counties nationwide.
Each dot is a county. The horizontal dividing line is “learned 1 grade level per year.” As you can see, counties teaching poor children less than one grade level per year (blue dots) easily outnumber those teaching more that one grade level per year (green dots).
Arizona counties are numbered. Maricopa County (1) has the highest rate of academic growth for poor children among large urban counties nationwide, 19.3% above one grade level per year. Mighty Maricopa, however, did not rank first in Arizona. That honor goes to Santa Cruz County (6), on the border of Mexico with a rate 29.3% above the dividing line.
Only one Arizona county, Greenlee (9), has a blue rather than a green shade to its dot. Greenlee, a small rural county in eastern Arizona, has no charter or private schools. The reader can decide for him or herself whether this is coincidental.
Arizona has 15 counties, but Navajo County has missing data for low-income students, so it does not appear in the chart; it does, however, have a healthy green dot for all students. County 15 is not technically a county and is not in Arizona. It’s in Orleans Parish, Louisiana, home of the original portfolio school district.
When Hurricane Katrina destroyed New Orleans, authorities found themselves with no students and little to offer but empty school buildings. Louisiana authorities, wisely, offered the use of those buildings to charter school operators in a request for proposal type fashion.
Most, and then all the schools, became charter schools. Students returned and academic results improved. The rate of academic growth for poor children in the Stanford data, averaging 6.8% above learned one grade level per year, shows admirable progress.
It remains an open question whether anyone will ever meaningfully replicate the New Orleans experiment in a sustained fashion. School boards are easy prey to regulatory capture by incumbent interests such as employee unions and major contractors.
The Arizona experience, fortunately, shows that high levels of academic growth for disadvantaged students can be achieved at a statewide scale and without a natural disaster. Arizona has the nation’s largest charter school sector and private choice programs, which in combination seems to have unlocked a very active system of open-enrollment transfers between district schools.
Arizona districts would die on a hill before being forced to convert to charter schools. Fortunately, there doesn’t seem to be much of a need to do so.
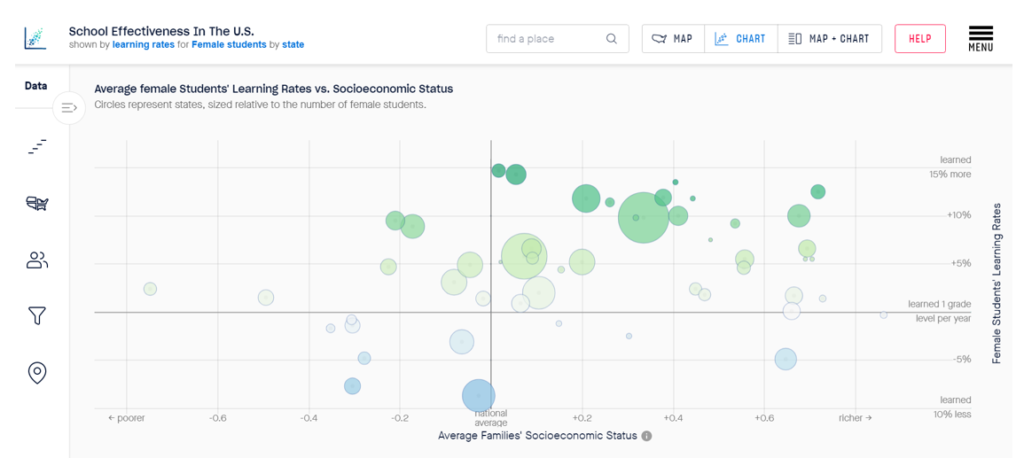
 The Educational Opportunity Project at Stanford University has linked state exams across states for grades 3-8. The chart below shows average test scores by state for female students. Green dots represent states with above-average achievement, blue dots are states with below-average achievement for female students.
Dots are sized by the size of the female student population. Florida is marked 1 to satisfy curiosity, but the key thing to note here is the ratio of green to blue dots. Other than that big blue California dot, the chart for females is pretty green.
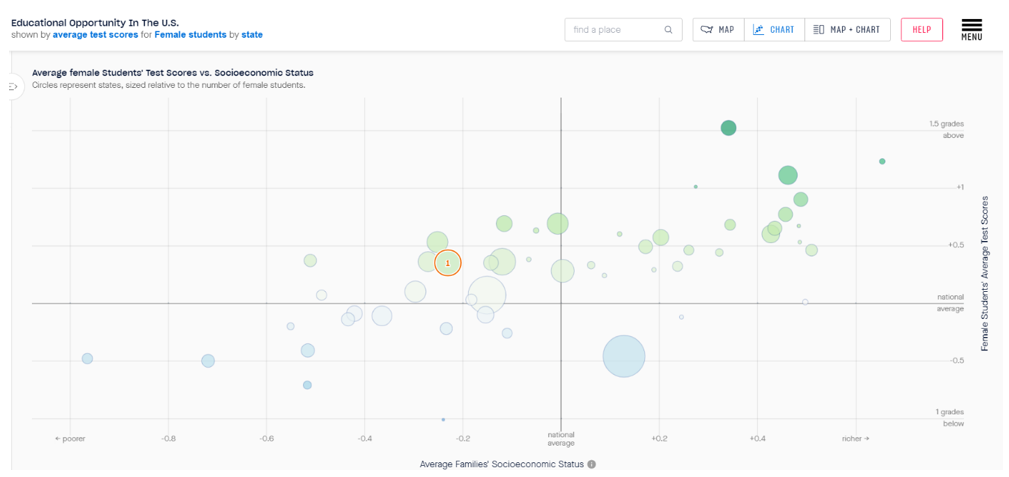 Now look at the same chart for male students by state:
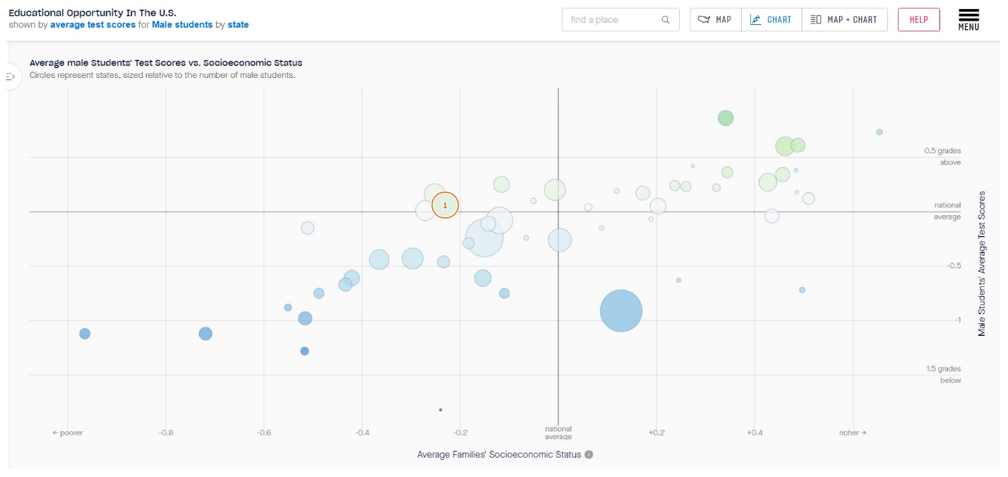
Not only has blue (below-average achievement) taken over in the male student chart, every state without exception shows lower achievement for boys than girls.
If you flip a coin 50 times and get the same result every time, something systematic is almost certainly in play. While poor and non-poor students often attend different sets of schools, boy and girls usually attend the same schools. An examination of the male-female achievement gap in Florida public schools found the biggest gaps associated with the lowest-performing schools.
The least effective schools in the Florida study weren’t great at educating females, but they are especially woeful at educating males.
Boys lead in all the problematic categories, such as expulsions and dropouts, and trail in all the important areas such as achievement, academic growth, graduation, college attendance and college graduation. Moreover, many of these trends have been evident in the data for decades.
One part of reimagining public education moving forward should be new education options for boys.
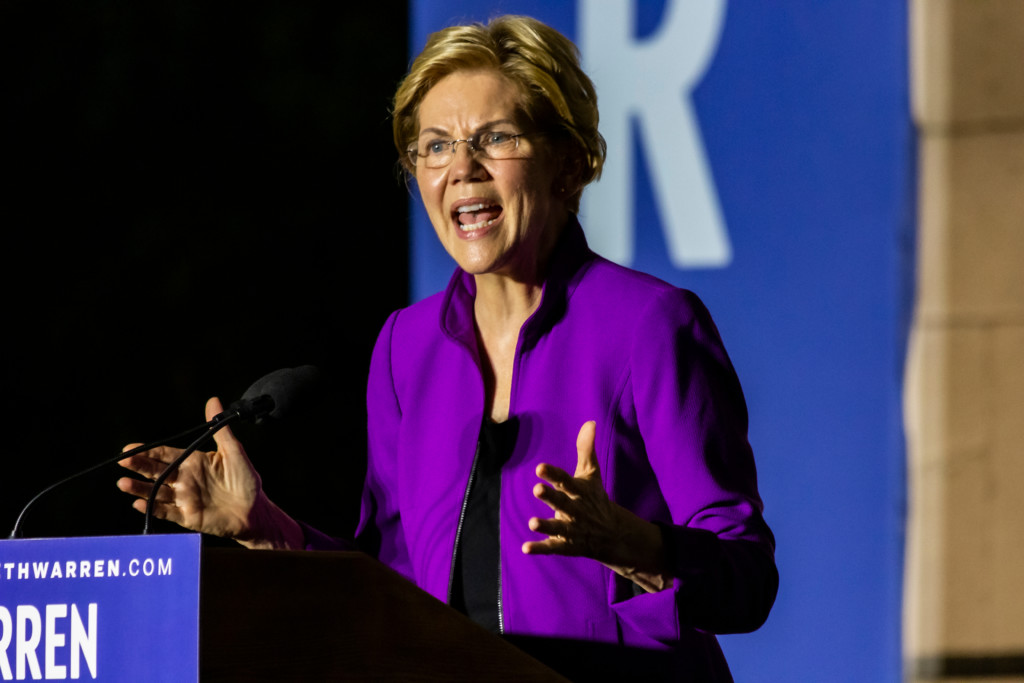
Democratic candidate for president Elizabeth Warren speaking at a rally Sept. 16 in Washington Square Park, New York City. Warren caused a stir last week when speaking to black and Latino charter school parents and supporters in Atlanta.
A recent protest of Elizabeth Warren’s education plan staged by a group of charter school parents at an event in Atlanta – which happened to include civil rights activist and education reform advocate Dr. Howard Fuller – resulted in a conversation between the senator and the parents that caused quite a stir. You can view the entire conversation here.
Go watch the video. I’ll wait.
Okay, good.
So, the big story coming out of this meeting has been Warren’s far-less-than-truthful denial about sending her children to private school. Her campaign subsequently admitted that her son attended public school “until fifth grade,” at which time he apparently attended a couple of different private schools.
But there were plenty of other interesting items in this conversation.
Warren protests at one point that Massachusetts and New Hampshire have good public schools. This, of course, is true, but Massachusetts and New Hampshire are two of the small handful of states with average six-figure incomes for families of four. If you examine data from the Educational Opportunity Project at Stanford University on student learning gains by poverty status, this is what Massachusetts and New Hampshire look like:
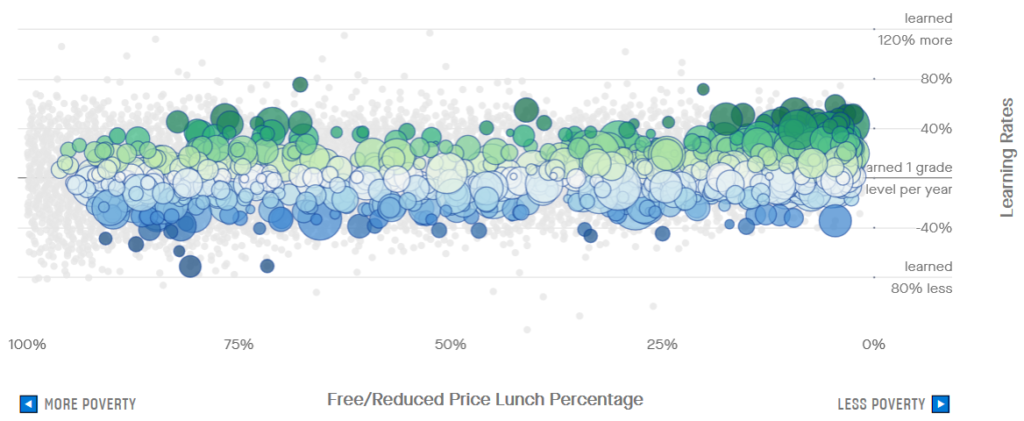
School effectiveness vs. free/reduced-price lunch eligibility; Massachusetts schools, all students, grades 3-8, from 2009-2016, sized by number of students
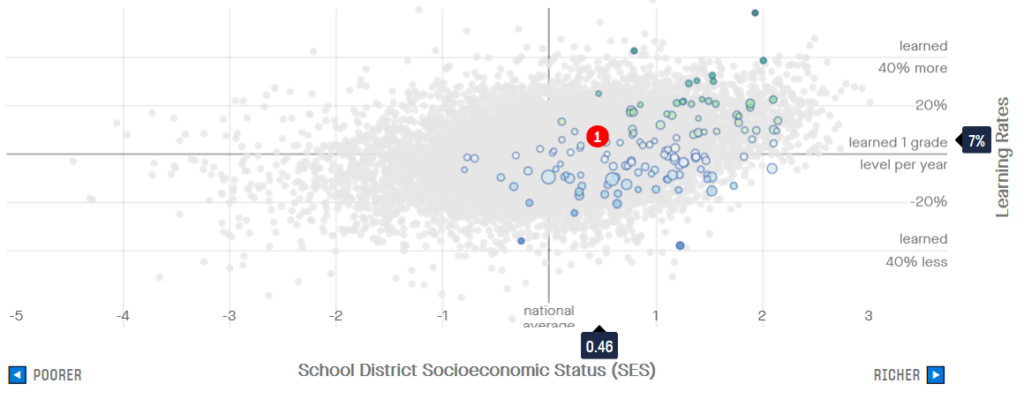
School effectiveness vs. school district socioeconomic status; New Hampshire districts, all students, grades 3-8, from 2009-2016, sized by number of students
On both maps, dark green represents high academic growth, and the right side of the charts signify a low percentage of students eligible for a free or reduced-price lunch. So, unless my eyes are deceiving me, the high academic growth schools in New Hampshire and (especially) Massachusetts cluster in the high wealth areas.
These schools may very well be “good,” but they aren’t exactly accessible.
Several of those high-poverty green schools on the left side of the Massachusetts chart are (you guessed it) charter schools. Just in case any of you are thinking this might be unfair and that every state’s growth chart is going to look like Massachusetts’ chart, take a look at this.
Warren claimed a few different times that she doesn’t oppose charter schools; she “just wants them held to the same standards.” Charter schools, however, because they are public schools, teach state standards and give state tests and get rated by the same metrics in all states.
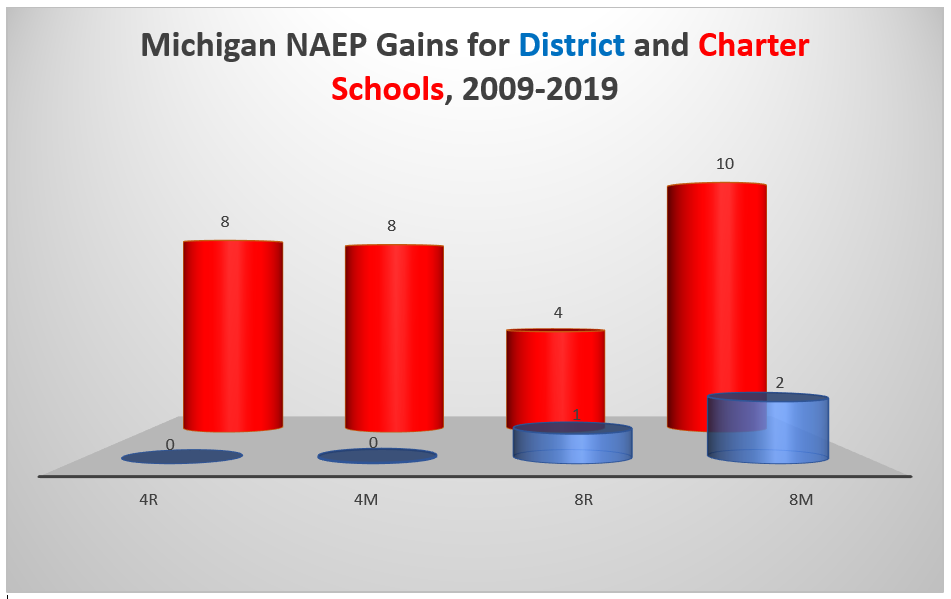
Warren specifically mentioned Michigan as a state where charter schools don’t follow the same rules.
I suggest we exempt Michigan district schools from whatever “rules” Michigan charter schools have been exempted from. Michigan district schools have shown a big dose of academic stagnation over the last decade, whereas students in Michigan charter schools at least show improvement over time despite clustering in what may be the most economically challenged urban area in the country.
There’s more than one way to hold school sectors to the same standards, and it would be a better idea to free Michigan districts than to shackle Michigan charters.
 It’s pretty clear watching the video that Howard Fuller has read the senator’s education plan, but the senator graciously offers to review it for him. Fuller, a former superintendent with the Milwaukee Public School System, sagely warns the senator that absent structural changes, many districts simply will absorb the funds she speaks of without improving.
The senator agrees, and cites a childcare block grant program for which she increased funding that suffered that precise fate; the money never reached the teachers. This experience perhaps ought to have informed the senator’s plan more than it appears to have done thus far.
The richest quote from this entire episode may have been one drawn from a New York Times piece about the issue, which quoted charter school operator Margaret Fortune:
“What would be happening in a fair society is we would be asked for our opinions, rather than having candidates saying, ‘I have a plan for you’ — to shepherd you into the very schools that you left on purpose.”
An especially interesting take coming from a black, lifelong Democrat.