 The Wall Street Journal recently reported that at the close of the 2020-21 academic year, women comprised 59.5% of college students, an all-time high. Men, at 40.5%, were at an all-time low, according to enrollment data from the National Student Clearinghouse. The Journal also reported that U.S. colleges and universities had 1.5 million fewer students compared with five years earlier, with men accounting for 71% of the decline.
Does the K-12 system bear some of the blame for this? The Educational Opportunity Project at Stanford University has data that will allow you to judge for yourself.
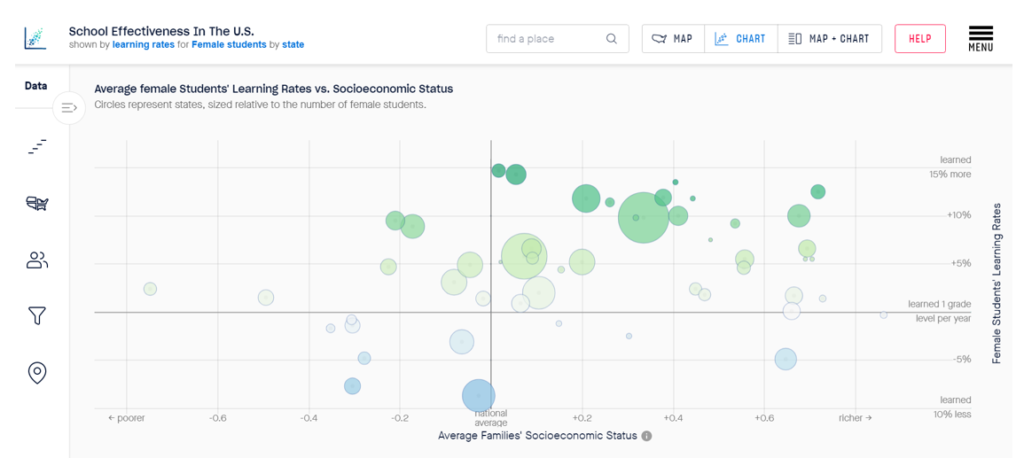
This graph shows data the Project collected on academic growth in grades 3-8 between 2008 and 2018 presented by state. The rate of academic growth for American students generally is low compared to other advanced countries. You certainly want to be above the horizontal line. For the most part, female students were showing above average levels of academic growth during the period covered.
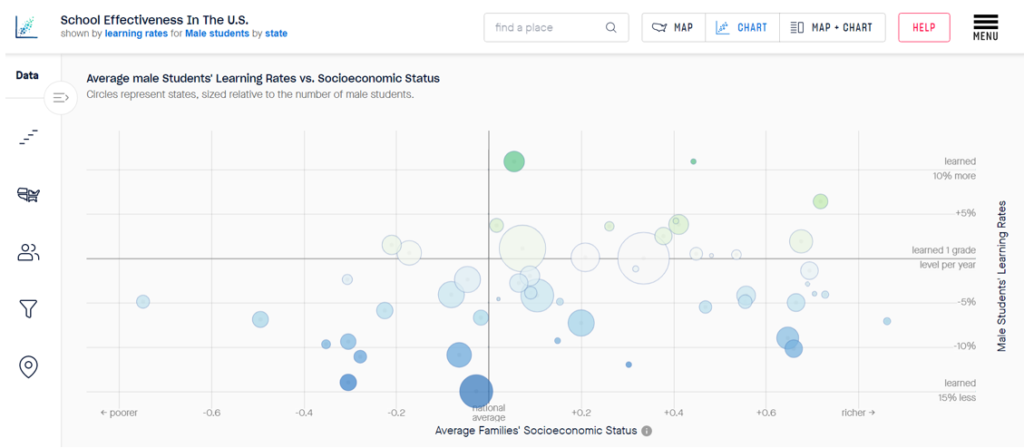
When examining the rates for boys in this next chart, the desired dark green dots get much scarcer, while the dreaded blue and dark-blue dots appear.
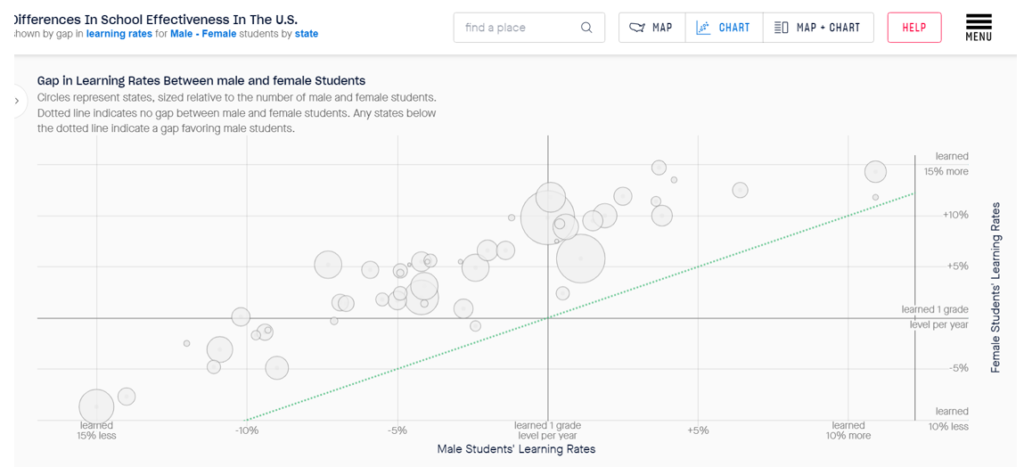
The Stanford website also allows you to compare gaps in growth rates. This graph shows that in every single state, the rate of academic growth for girls exceeded those of boys. The issue appears to be a far cry from being random.
Mind you that all this data was gathered before the COVID-19 disaster.
ZIP-code assignment into a system of largely non-specialized schools bound and determined to maximize non-teaching employment for adults isn’t working out for boys. Having these schools go through the motions of being held “accountable” so as to avoid being put on double secret probation appears ineffectual, or perhaps even counterproductive.
It’s unclear the extent to which the K-12 status-quo is either the problem or part of the problem, but the second chart makes it abundantly clear that it is not much of a solution. It’s time for new approaches and school models.

While 1958 Edsels boasted multiple advanced features, the launch of the model line became symbolic of commercial failure; introduced in a recession that catastrophically affected sales of medium-priced cars, Edsels were considered overhyped, unattractive and of lower quality.
The central problem in American K-12 education, as John Chubb and Terry Moe instructed us years ago in their book, “Politics, Markets, and America’s Schools,” is politics.
In most human endeavors, we make more of what people want. If people want less of something, they stop purchasing it, quickly sending a signal to producers to make less of it.
Americans are fairly unsentimental about producers who ignore their instructions.
Henry Ford once said his customers could have one of his cars in any color they like, as long as it was black. Ford apparently imagined himself operating in a market without viable competitors, but the American public collectively disabused him of this notion by purchasing other vehicles. The Ford Motor Company lost its status as a market leader and was forced to retool its efforts/attitudes in order to survive.
Now imagine if the American automobile industry functioned like the American K-12 system. In this scenario, states draw car purchase boundaries around car manufacturing plants. Residents within this boundary pay taxes to their local plant, which is overseen in theory by an elected board. In practice, these elections are low-profile, non-partisan and often attract 10% or fewer of eligible voters. The United Autoworkers find it relatively easy to influence these elections.
Imagine a world in which the Ford Motor Company was able to utilize politics to keep making Edsels and Model Ts and Model As for decades on end.
Tiebout choice still exists, however.
If you want a car other than an Edsel, that’s no problem; you can move to a Corvette zone if you like. Yes, real estate is pricier in the Corvette zone, but your friends and neighbors intimate to you that you get what you pay for, and it’s for the children.
You also can buy a vehicle from an independent car company, but you must pay your Edsel taxes regardless, placing such vehicles out of the financial reach of most Americans.
Run this story forward a few decades. Wealthy families have long since departed from the Edsel districts and their like, having paid a real estate premium for fancy districts. The car districts continually claim they need more money to produce better cars, and taxpayers continuously provide it.
They really want a good car, and it is difficult to imagine a different system. Academic improvement generally happens at a rate nothing like the increase in spending.
Highly segregated by income and race, the public car system and the now very politically powerful interests with a stake in the status-quo become quite adept at opposing and/or undermining efforts to improve productivity in the industry. The system stands rigged in favor of the wealthy and in favor those who make Edsels; Edsels today, Edsels tomorrow, Edsels forever.
Just in case you suspect embellishment, let’s take a look at just how rigged the K-12 system is against the poor. Data from the Educational Opportunity Project at Stanford University will do the trick.
 This chart will take some decipherment, but it is worth it, so stick with me.
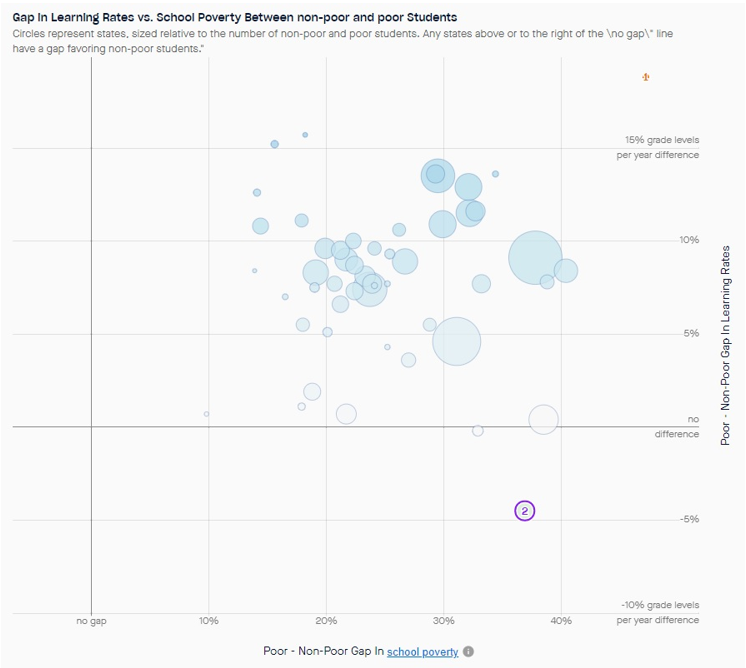
Every dot is a state. The chart shows the differences in academic growth between non-poor and poor students. Every state above the horizontal “no difference” line has a faster rate of academic growth for middle and high-income students than low-income students. Yes, it is almost everywhere.
Way at the top right, marked “1,” is the District of Columbia with the largest gap in favor of the non-poor and rich. The District of Columbia, after turning a large portion of the education of low-income D.C. students to charter schools, managed to get the academic growth rate for poor students to the national average.
Low-income students in D.C. need a faster rate than average if they are to close achievement gaps, but one suspects matters were even worse in decades past.

May the odds be ever in your favor, rich D.C. kids!
Non-poor D.C. students, meanwhile, learn at a rate 18.5% faster than the national average. Buying into that Telsa, sorry, Georgetown attendance zone will cost you a fortune, but it runs like a charm for your little darling and will take him where he wants to go.
District of Columbia Public Schools have become remarkably adept at one thing: serving the academic needs of the wealthy. The poor, not so much.
Returning to the chart, a small number of states are near the horizontal “no difference” line. None of them, however, have an impressive rate of academic growth for either non-poor or poor students.
The lone outlier, marked “2,” has a fast rate of academic growth for non-poor students and an even faster one for poor students. The learning rate for non-poor students is 11.4% higher than the national average. The learning rate for poor students, however, is 17.4% above the national average, so there was gap-closing happening in this state in the period covered (2007-2018).
Arizona, which spends perhaps one-third of the per-pupil amount spent in D.C., is state 2 on the chart. Arizona has the largest state charter school sector (around 21% of students statewide); an unusually active system of open-enrollment between district schools (about one-third of Phoenix-area students attend a non-zoned district school); and private choice programs. When the Education Freedom Index was updated after two decades, Arizona ranked first for choice in both studies.
This did not happen overnight.
The Stanford Educational Opportunity Project data does not show that Arizona students had high rates of proficiency during this period, rather that students learned more than those in any other state per year. An “Edsel district” in Arizona faces real consequences for dissatisfied families, who can move to other districts, to charters, or to a still limited but nevertheless meaningful extent to private schools with financial assistance.
School districts still educate a large majority of students, but they also are the most active choice players. Districts still have low turnout, the United Auto Workers still lobby for more money, but from an academic growth standpoint, they largely stopped making Edsels before the pandemic.
Florida, Indiana and West Virginia all look poised to make major choice advancements this year. The key to a virtuous cycle of improvement in my view will be getting the Corvette districts the right incentives to lower the drawbridges to let Edsel district kids past their moats and into their schools.
When they do, you just might see those districts produce something better than an Edsel.
 Recently, I watched Liberty: the American Revolution. The documentary includes a dramatization of letters Abigail Adams wrote to her sister while her husband served as United States ambassador to Great Britain.
Abigail was less than impressed with “his Britannic majesty” and the other members of the British royal family, a family she noted to be “inclined to corpulence.” She observed that the English boasted of the beauty of the English princess, but it took more than a tiara to impress Abigail Adams.
“Your simple American girl is much prettier,” she noted, concluding, “There is a servility of manners here, a distinction between nobility and common citizens, which happily is foreign to Americans.”
Abigail’s lack of deference and her inclination to judge beauty by her own standards came to mind when I saw a new ranking of state charter school laws. Back in 2018, I offered a light-hearted nudge to my friends within the national charter school organizations with a post titled It’s Time for Technocratic Beauty Pageant Charter Rankings to End.
The basic point I attempted to make is that the charter school movement has fallen into the habit of passing charter school laws that haven’t produced many actual charter schools. Ranking charter-lite charter laws highly in ranking exercises seems even more dubious. Alas, I failed to prove persuasive as the National Alliance for Public Charter Schools released a new ranking of charter school laws last week, again judging laws against a model bill.
 Stanford University’s Opportunity Project, however, has created a new tool that might help illustrate the point, so I’ll try again.
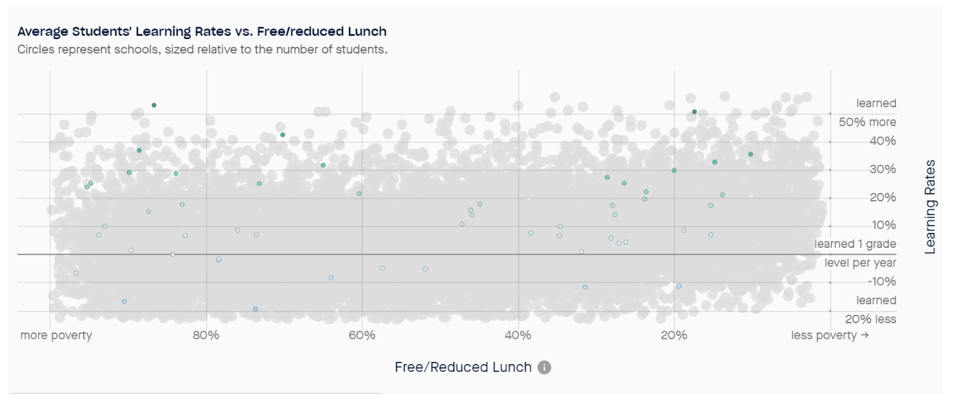
The chart above is drawn directly from the Opportunity Project’s data explorer and shows the academic growth scores for the charter schools in the state of Indiana. Indiana’s charter school law has placed first multiple years in a row in both the National Alliance and National Association of Charter School Authorizers (NACSA) rankings.
In these charts, green dots denote charter schools with above average rates of academic growth, blue dots below average academic growth. The grey dots in the background are the shadows of every other school in the country.
Academic growth isn’t the only criterion for judging schools, let alone a perfect one. New schools full of students who just transferred in, for instance, might be at a disadvantage; this would apply especially to youngish charters. Some of these schools also are likely alternative schools doing dropout recovery. With those caveats in mind, let’s proceed.
So, what to make of the Indiana charter sector’s outcomes?
There certainly are some high performing schools – four schools with a rate of academic growth 20% or more higher than the national average. Note, however, that an equal number have rates 20% below the national average. Counting the dots in Indiana reveals 21 high growth green dots, 22 lower growth blue dots, and one school right on the national average.
Like Abigail Adams, suffering through hours of Britannic court pomp, color me less than overwhelmed.
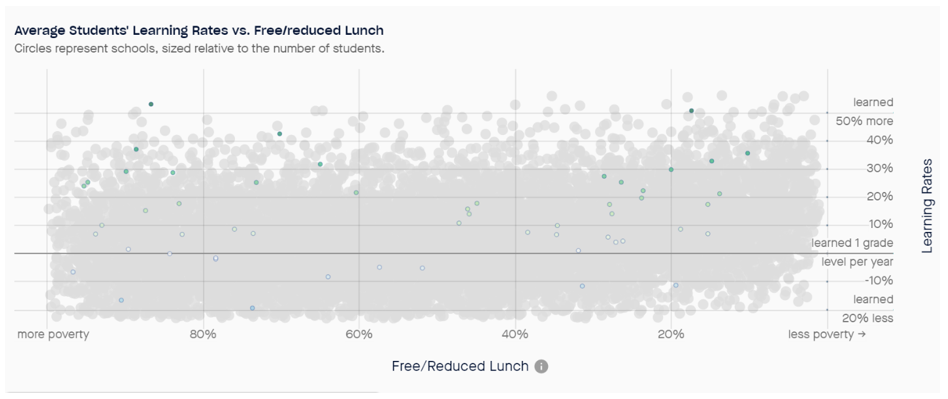 Next, let’s look at Indiana’s neighbor, Wisconsin. Wisconsin ranks 39th in the National Alliance rankings, which is near the bottom, as there only are 45 states with laws).
Wisconsin has a smaller population than Indiana but more charter schools. Wisconsin has five times as many charter schools showing academic growth 20% or more higher than the national average than Indiana. Wisconsin, moreover, has zero charter schools with a rate 20% below the national average.
Call me crazy – it’s been too long since anyone has – but by my way of thinking, Wisconsin has a better charter law than Indiana because it has created more high-quality opportunities for students.
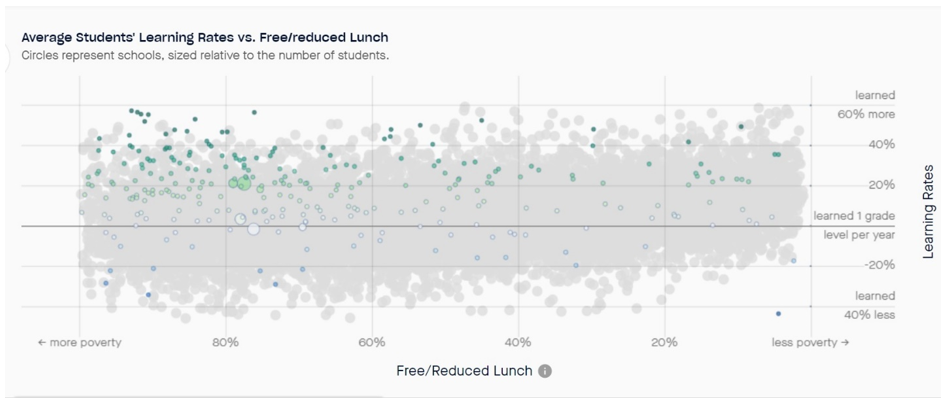 Now imagine you are working on charter schools in Texas, which came in 29th in the National Alliance ranking. Texas is a much larger state than Indiana, but note the ratio of dark-green schools to dark-blue dots in the Texas chart and compare it to the Indiana chart above.
How much servility of manners would we expect Texans to show towards the Indiana law? Texas appears to have approximately three times more charters with rates of academic growth 20% higher than the national average than Indiana has in total charter schools, after all.
In my opinion, we ought to judge the beauty of charter laws not by their adherence to a model, but rather by their outcomes. If the model law continues to coronate a law with a notable lack of seats, schools or academic growth, the tiara raises more questions about the model than it bestows glory.