New research by the American Federation for Children found that scaling Florida’s Tax Credit Scholarship Program over 15 years improved public school student achievement.
The report published March 4 by AFC senior fellow Patrick Graff, a former Florida Catholic school teacher, compared two leading peer-reviewed studies of each approach that used Florida data: a 2023 study of Florida’s Tax Credit Scholarship Program over 15 years and a 2024 analysis of the effects of additional school spending on student achievement.
Key findings
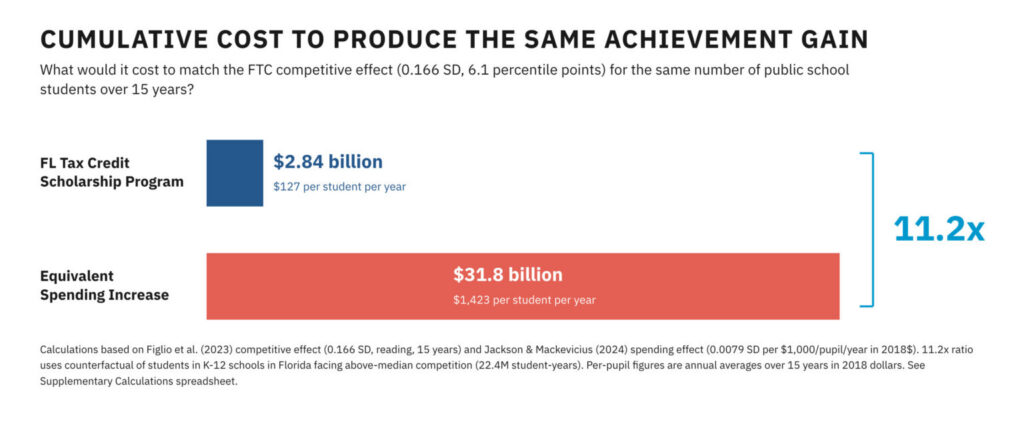
Not a zero-sum game: Florida’s experience shows that school choice can benefit students, no matter where they learn, families, and taxpayers at the same time. Florida now enrolls over half a million students in private school choice programs, and its public school students still outperform students in most states while spending less.
Read the full report here.

Last week, the Heritage Foundation released a study from yours-truly called From Mass Deception to Meaningful Accountability: A Brighter Future for K–12 Education. The basic argument: the good intentions of the No Child Left Behind era were completely undermined by opponents, who both defanged state rating systems and tamed charter school laws. On the first assertion, I offered charts like:

Ooof, and even worse this comparison between Arizona’s school grades in Maricopa County and GreatSchools private ratings for schools within 15 miles of Phoenix (the closest approximation on the GreatSchools site) after converting the GS 1-10 ratings onto a A-F scale:
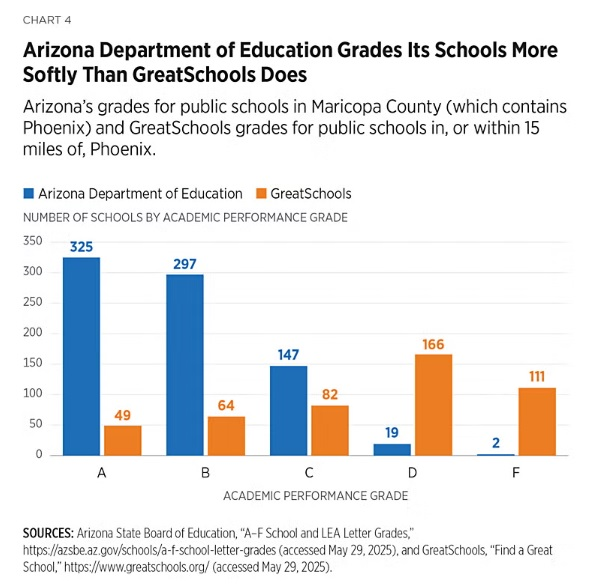
Charter schools always and everywhere had waitlists, ergo, accountability amounted to “trophies for everyone” state systems and charter school sectors that never matched demand with supply. Take a look at the above chart, however, and you’ll see that GreatSchools is a much, much tougher grader than the state of Arizona. The usual suspects have a much tougher time undermining private rating organizations, and they gather reviews (which research shows families value). Ergo the backgrounder makes the argument that we should not rely upon state rating systems in preference to the already superior, more trusted and versatile private efforts. Furthermore, we should expand rating systems into the broader universe of education service providers active in today’s ESA and robust personal use tax credit programs, specifically to gather reviews accessible to families for purposes of navigating the wide world of choice, which we need much more of.
Okay so a couple of reader requests. First, I was asked if I could create something like the Phoenix chart for a district in Florida. I chose Miami:

So not as much of a contrast as Arizona but…if I were looking for a school in Miami, I would look at GreatSchools.
Next, I received a request about this chart from Sandy Kress:

Putting the NAEP improvement numbers in context: In the 2024 NAEP, the total across the four mathematics and reading exams between the highest scoring state (MA) and the lowest scoring state (New Mexico) was 10%. So, the nation-leading 5% improvement in Mississippi scores should be seen as meaningful. Sandy asked me to look at an earlier period from the mid-1990s until 2011 rather than the 2003 to 2019 period, as his contention was that that period saw a lot more academic improvement before the federal law was defanged on a bipartisan basis during the Obama administration.
All states began taking NAEP in 2003, so stretching back to the 1990s loses a number of states. Also, 1996 didn’t include the two reading tests, so I substituted 1998. Nor can we automatically attribute the trends exclusively to standards and accountability (other things also going on), but Sandy is correct that NAEP showed a lot more academic improvement during those earlier years:
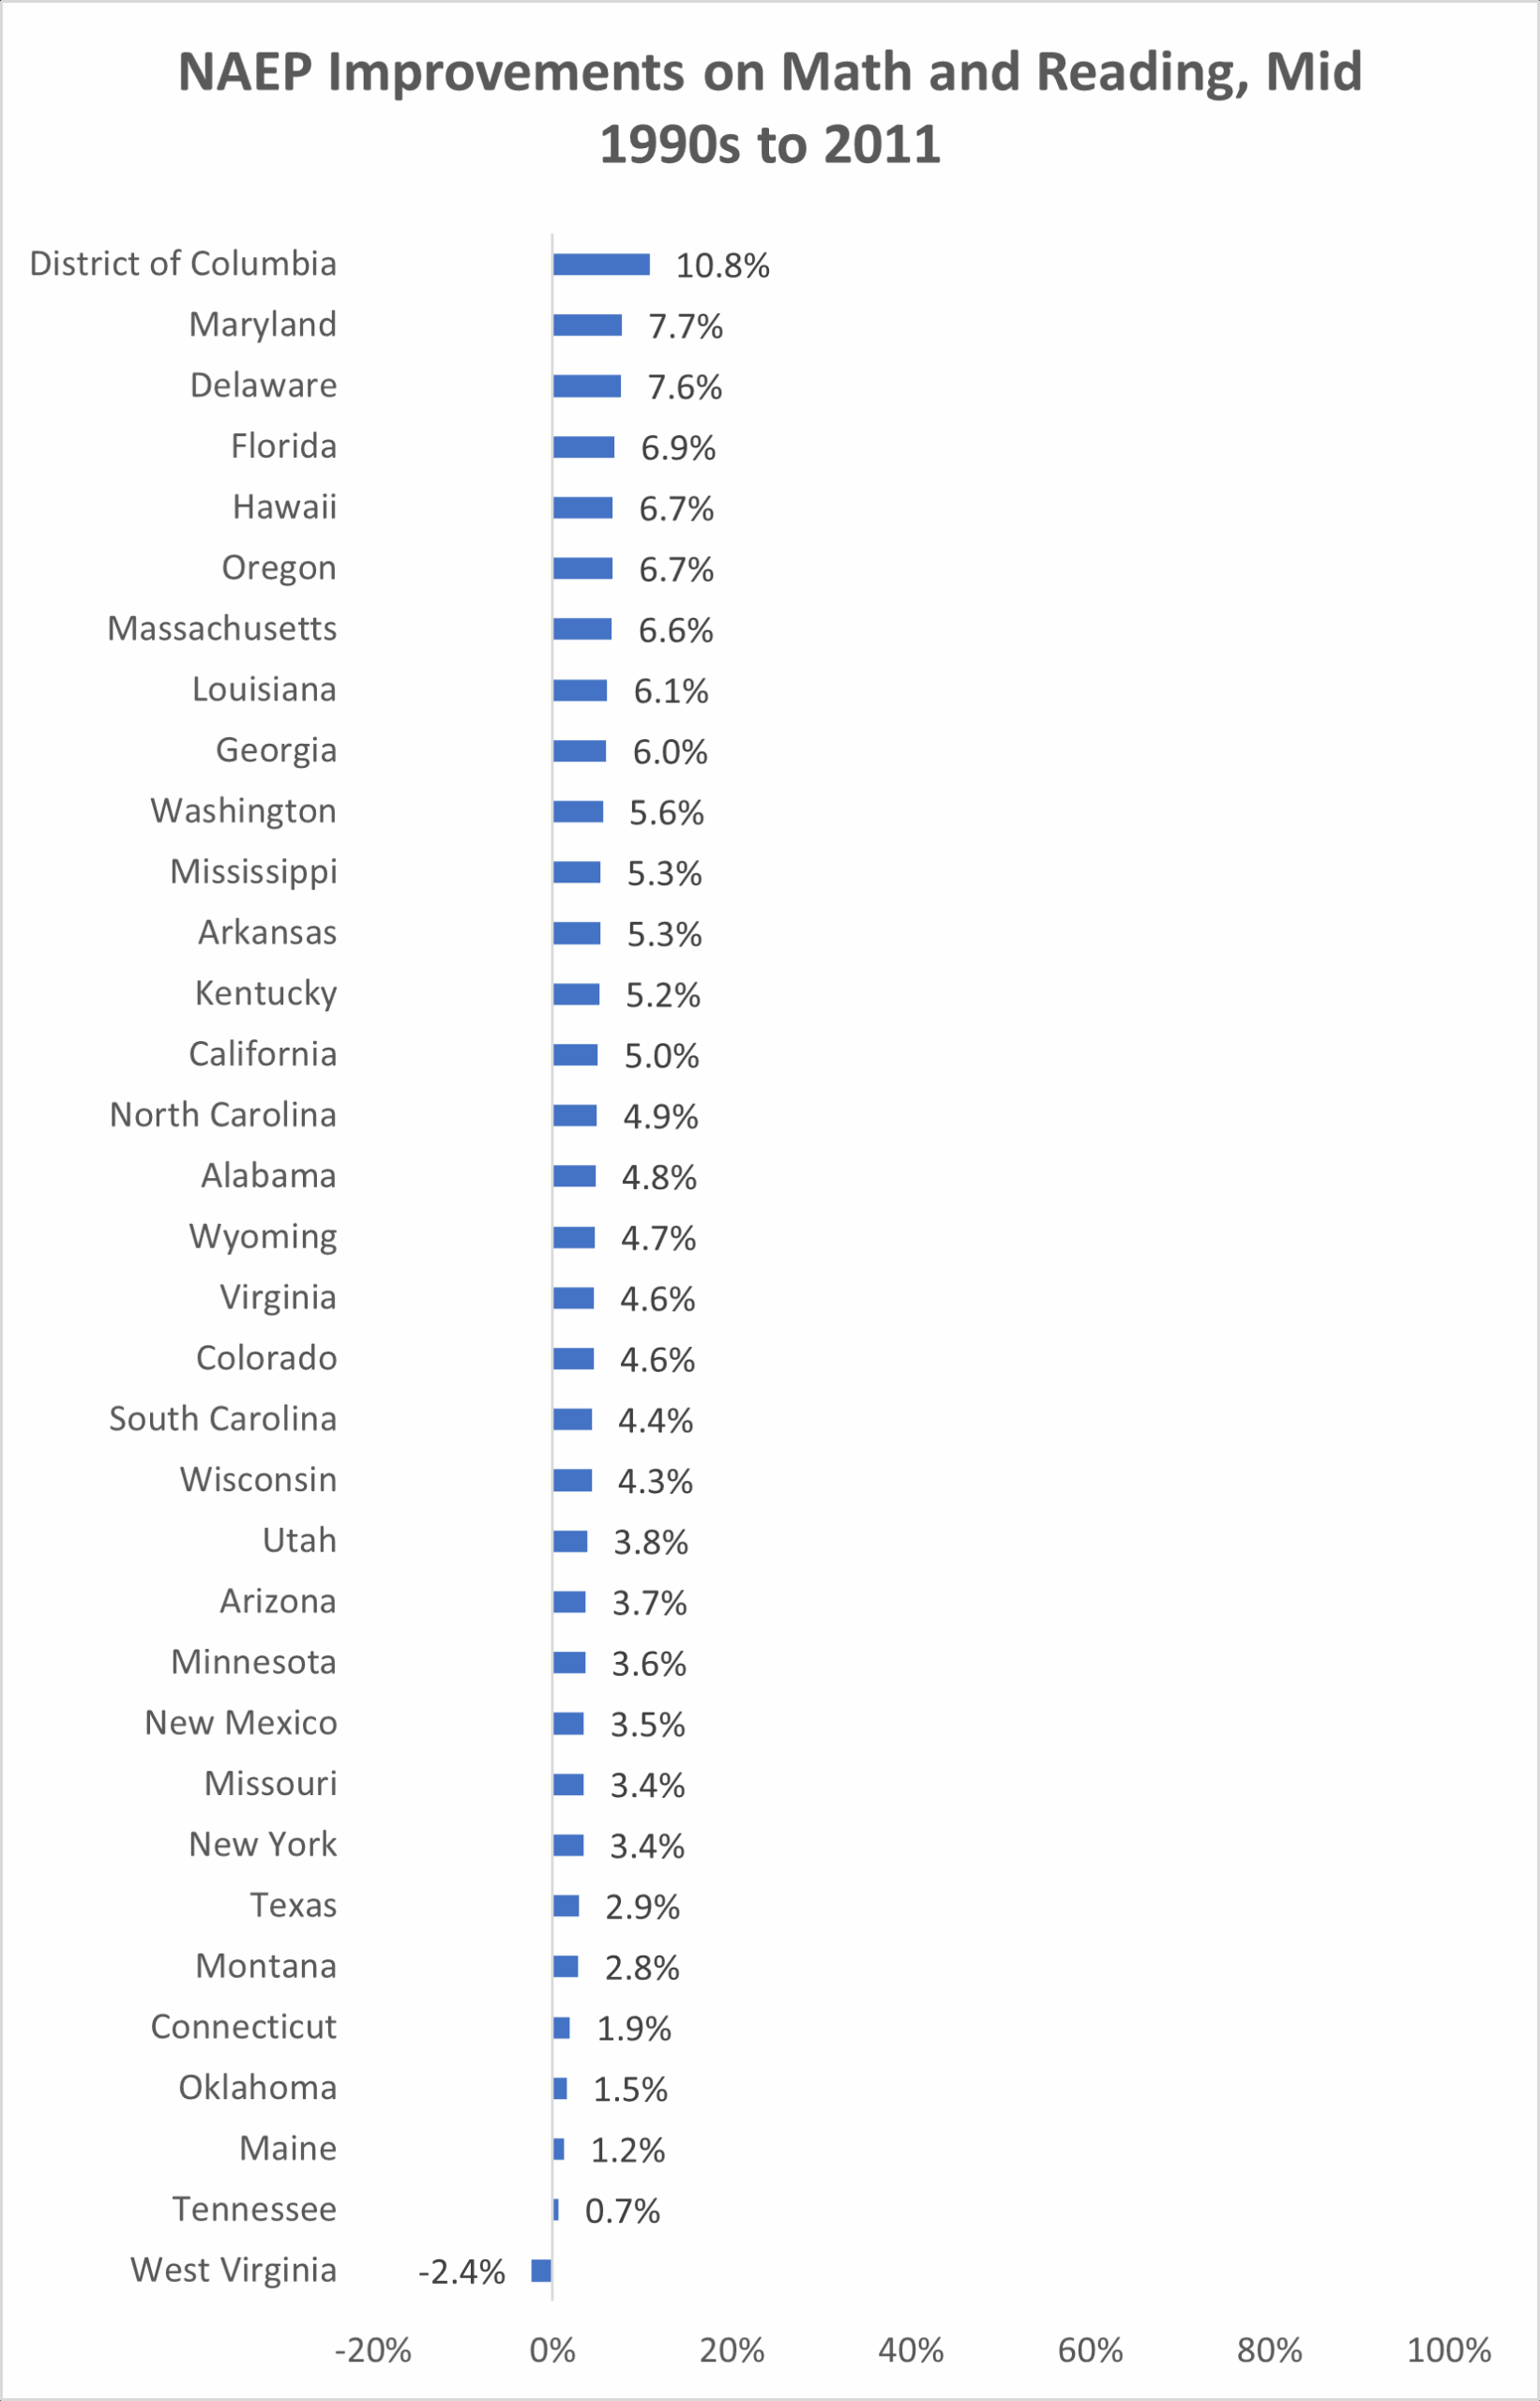
Accountability hawks/the federal government may have indeed coaxed more productivity out of the public school system. Then on a bipartisan basis, Congress removed federal pressure (passed the Senate 85-12 and the House 359-64). Subsequently a large majority if (perhaps?) not every single state merely went through the motions of “accountability” with trophies for (almost) everyone. Kress can justifiably look at these data to claim, “the juice is worth the squeeze” and I can look at the same data to say, “academic transparency is too important to leave to politicians and their appointees.”
Franklin Roosevelt noted ““It is common sense to take a method and try it. If it fails, admit it frankly and try another. But try something.” Every state in the union remains entirely free to adopt tough accountability practices, but apparently few if any have chosen to do so. The next something to try in my opinion are enhanced private rating systems and robust choice programs. Temporarily semi-tough accountability systems run by states and charter school waitlists ultimately proved to be a strategy with limited political sustainability.
Student achievement has fallen to its worst levels in two decades. Throughout public education, we see blaring sirens that our students deserve better.
 At the same time, states across the country – most recently Idaho and Texas – are embracing increasingly expansive policies to give parents direct control of public education funding.
This latter trend has the potential to turn around the former.
The reason is simple, but it cuts against the conventional wisdom about school improvement.
Systemic improvements are the key to better results. The legendary management guru, W. Edwards Deming, estimated that 94% of organizational productivity is determined by the systems within which people work. Hiring better people will not improve productivity if workplace systems do not also improve.
Imagine the world’s best NASCAR driver enters the Daytona 500 driving a car with a top speed of 90 miles per hour. Despite being the best driver on the track, this driver will lose. The system, in this case the car, is not designed to give the driver any chance to succeed.
Our low-performing systems in public education undermine the productivity of our teachers and students. The question is: how can we build higher-performing systems?
Four decades of improvement efforts led to public education’s third era
The idea that public education needs systemic improvements is not new. The 1983 report, A Nation at Risk, led to several decades of education reform initiatives. But as the most recent NAEP scores indicate, these efforts have generated mixed results.
Performance improved during the decade from 2003 to 2013, when the nation’s average fourth-grade math scores increased by seven points.
This period roughly coincides with the implementation of No Child Left Behind, perhaps the most ambitious top-down education improvement initiative in our country’s history.
But that improvement proved politically and practically unsustainable. Observers like Tim Daly argue that since the high-water mark of 2013, students and teachers have been living through an “education depression.”
I’m optimistic about a new generation of efforts to improve public education. They have a higher probability of being successful and sustainable, in part because they are rooted in larger societal changes, such as the rise of digital networks, mobile computing, and artificial intelligence.
These changes are transforming all aspects of our lives, including where and how we work, communicate, consume media, and educate our children.
These larger societal changes are pushing public education into what I call its third major era.
Shifting power to parents and educators
In this emerging third era, public education aspires to provide every child with an effective, customized education through an efficient public education market. This requires redistributing power from government to families and educators.
Money is power. A growing number of states equip families with flexible spending accounts, commonly called education savings accounts (ESAs), that enable families to use some of their children’s public education dollars to buy the materials and services they need to customize each student’s education.
In Florida, the families of over 500,000 public education students are spending more than $3.3 billion this school year to meet their students’ educational needs. This level of spending is giving Florida families power they have never had.
It is also empowering Florida’s educators to create innovative learning environments such as microschools, hybrid schools, virtual schools, tutoring programs, and homeschool co-ops, because families, including lower-income families, are now able to pay for them. School districts and charter schools are also strengthening Florida’s public education market, expanding options for students and even providing classes and other learning opportunities to ESA families.
This virtuous cycle between supply and demand has never existed in public education markets because the system’s primary customers — families — have never controlled public education dollars.
The rise of public education markets
Across the country, 21 states have created some form of ESAs or robust individual tax credits that allow families to participate in their states’ increasingly robust public education markets.
Many of these newly created programs differ from the earlier voucher programs in two important ways. First, they are open to all families, not just small, targeted groups, such as low-income families or students attending underperforming public schools.
Second, they allow participating educators to create a wide range of diverse learning opportunities for students, some of which look nothing like conventional schools.
An earlier generation of voucher programs largely served as an extension of top-down school accountability. They provided states with an extra “stick” to punish low-performing public schools, giving unsatisfied parents an opportunity to choose private schools instead.
Charles Barone and other critics are right to point out that those policies are unlikely to produce transformational improvements in public education.
Those earlier voucher programs did not work because they were too limited to produce a functioning market for education services. Families had limited flexibility in how to spend the money. They could select only conventional private schools, so educators were limited in their ability to offer new, different or better learning options. And only a small number of families were eligible, so there wasn’t enough demand to unleash the virtuous cycle of the market.
Creating state public education markets in which families are free to choose from a variety of learning options and educators are free to create new ones increases the chances that more educators will design the educational equivalent of new racecars with higher top speeds.
These systemic improvements are more likely to be sustainable because market-driven innovations do not require top-down coercion.
When NAEP scores rise again — and they will — the increased productivity enabled by well-functioning public education markets will be the primary reason.
The National Assessment of Educational Progress (NAEP) created a new measure of socioeconomic status for the 2024 exams. This is a welcome addition, and a better measure of student economic status has proven revealing, specifically regarding charter school performance. Shifting eligibility criteria made the reliability of the old standby, free and reduced-price lunch, questionable over time. The new socioeconomic status variables incorporate surveyed measures of the number of books in the home and parental education into a new measure. Charter schools have succeeded in large part in their core goal of improving the academic achievement of disadvantaged students.
A few caveats before jumping in: we have no trend data yet. Obviously, not all states have charter schools, and even fewer have charter sectors large enough to report NAEP achievement for charter subgroups.
The COVID-19 shutdowns impacted all these scores. Finally, NAEP is given to representative samples of students across states, so subsamples (low-socioeconomic status students) of subsamples (charter schools) can have large standard errors, which you can think of as the plus/minus that goes along with polling. This means both the red and the blue lines can be either too big or too small, or both at the same time.
Finally, differences may or may not reflect faster rates of learning by sector as it is not possible to control for all student differences with snapshots of achievement. Random assignment studies can (and have) shown positive academic impacts of charter school attendance, whereas NAEP data should be seen as merely suggestive. We are peering through a glass darkly, and as such I’ll try to bring in some other data along the way.
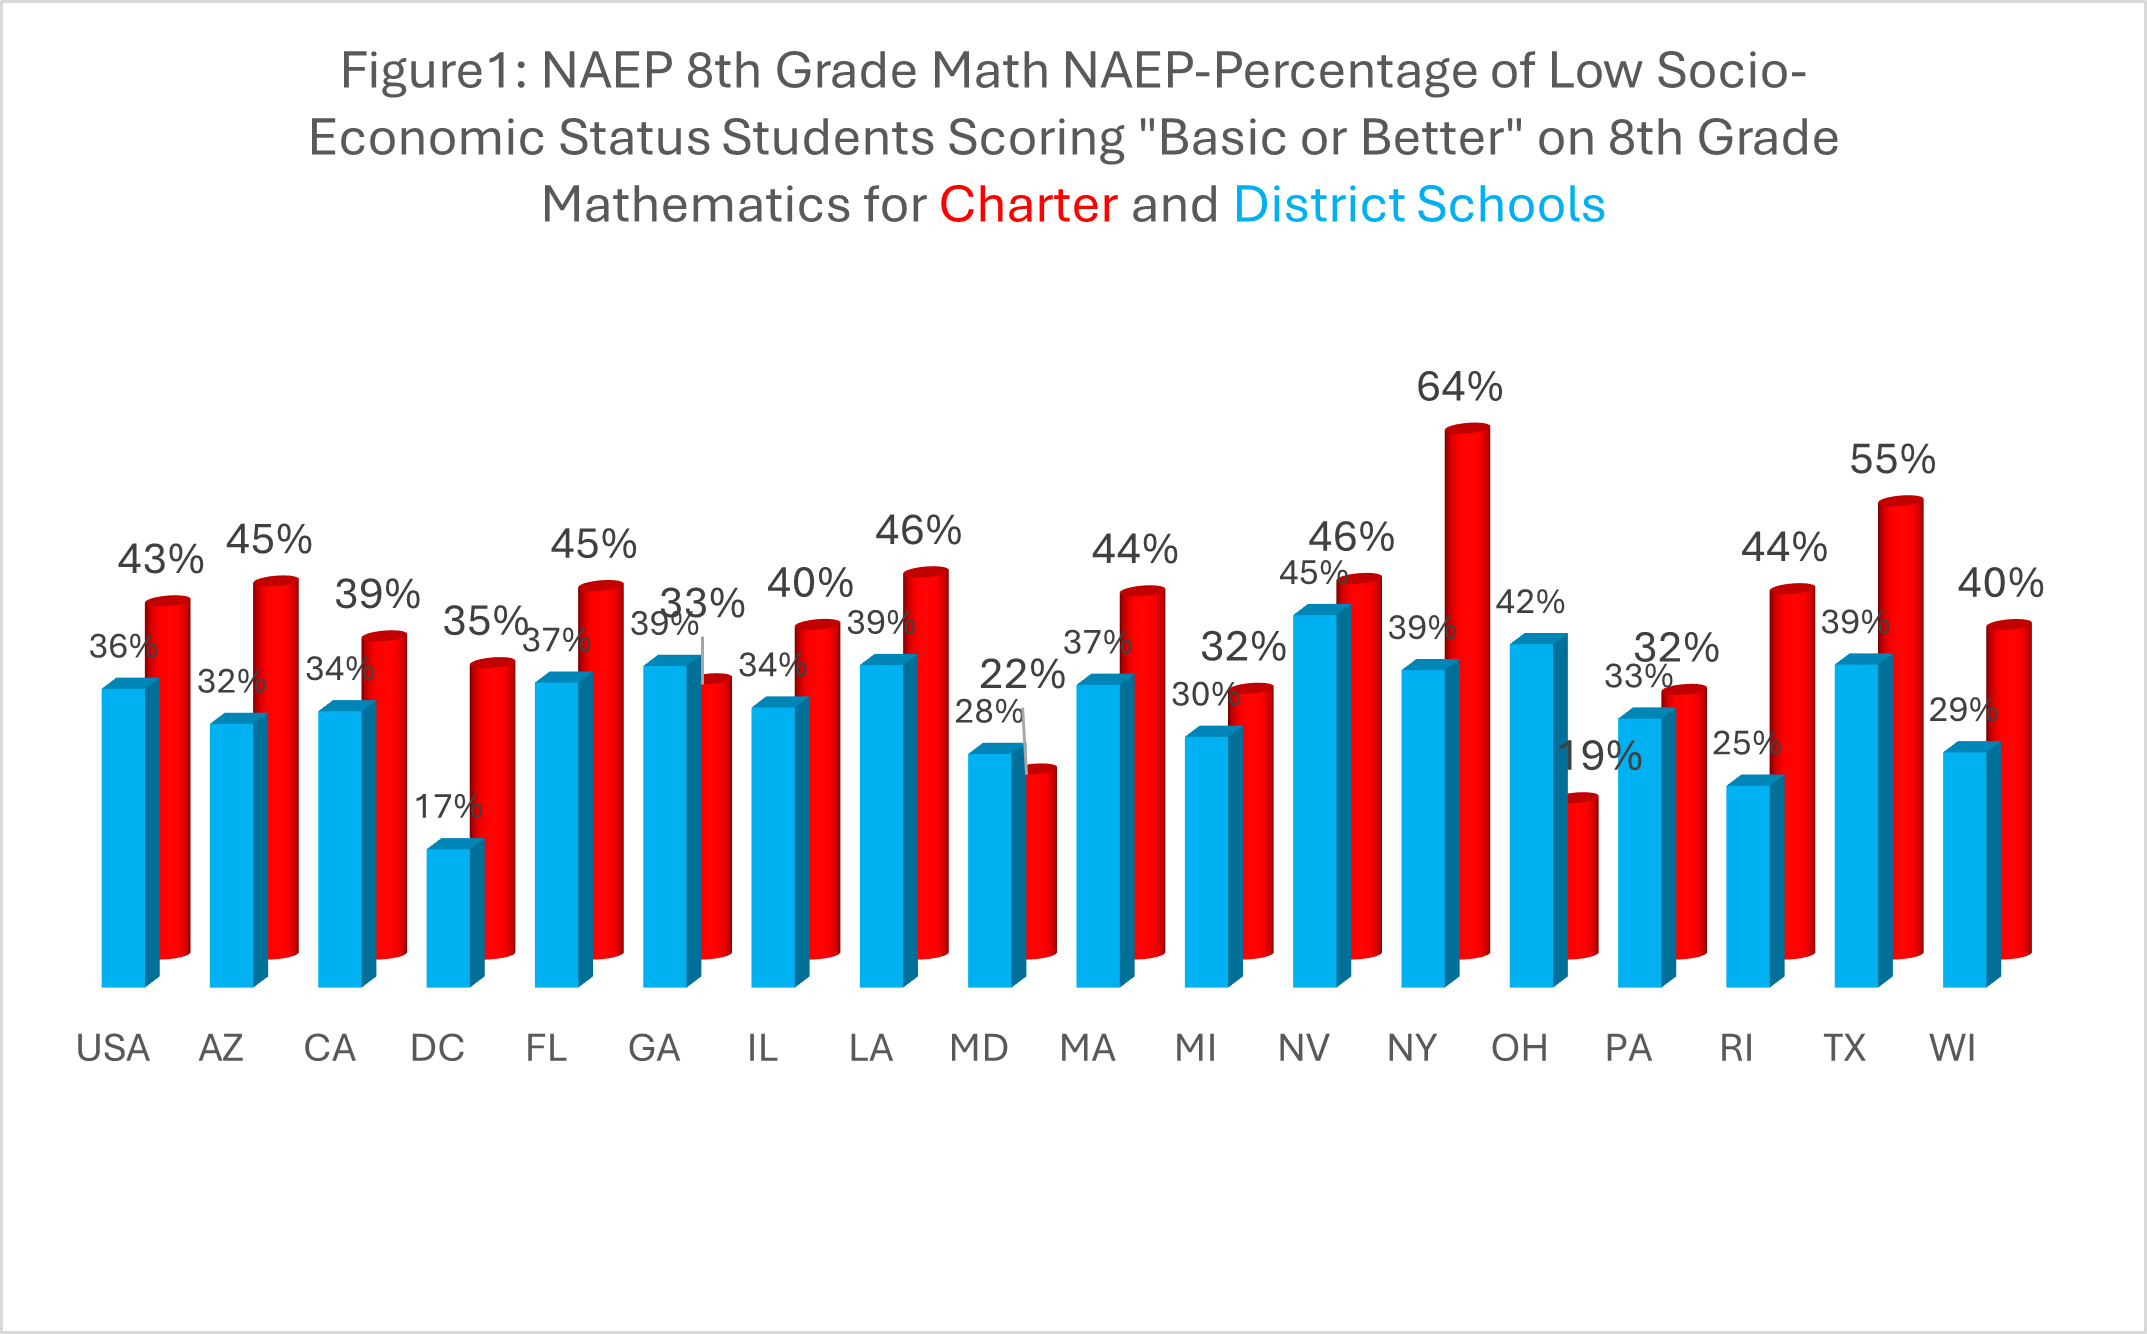
Having said all of that, with a few exceptions, the red-colored charter columns tend to be larger than the accompanying blue district columns. Just for some perspective, the difference between the nationwide “Basic or Better” number of 43% for charter schools as compared to 36% for district schools is statistically significant, meaning that it is unlikely to have been caused by chance.
Some of the red columns are much larger than their corresponding blue columns. For example, in the District of Columbia, low socioeconomic status charter school students hit the “Basic or Better” threshold at more than twice the rate as their district peers. This is no mean feat, especially since Patrick Wolf and his coauthors found that the District of Columbia Public Schools spent $4,245 more per pupil than DC charter schools in 2019-20. The Stanford Educational Opportunity Project also shows a faster rate of academic growth for DC charters between 2008 and 2019, which is at least directionally similar.
Should we take 64% of low socioeconomic status students in New York charter schools at face value? Perhaps so. CREDO’s analysis of charter performance found New York City had some of the highest performing charters in the nation. Using a matching research strategy, the researchers found that New York City charter students received the equivalent of 80 days of extra math instruction compared to their district-matched sample.
Obviously, what you should do with a sector of school that is crushing the academic ball with highly disadvantaged students is to cap the total number you can have, which is what New York’s highly ethical lawmaking class has done. They can’t get enough of New Yorkers becoming Floridians.
The same crosstab procedure for the eighth grade reading exam produces information for fewer states, as seen in Figure 2 below.
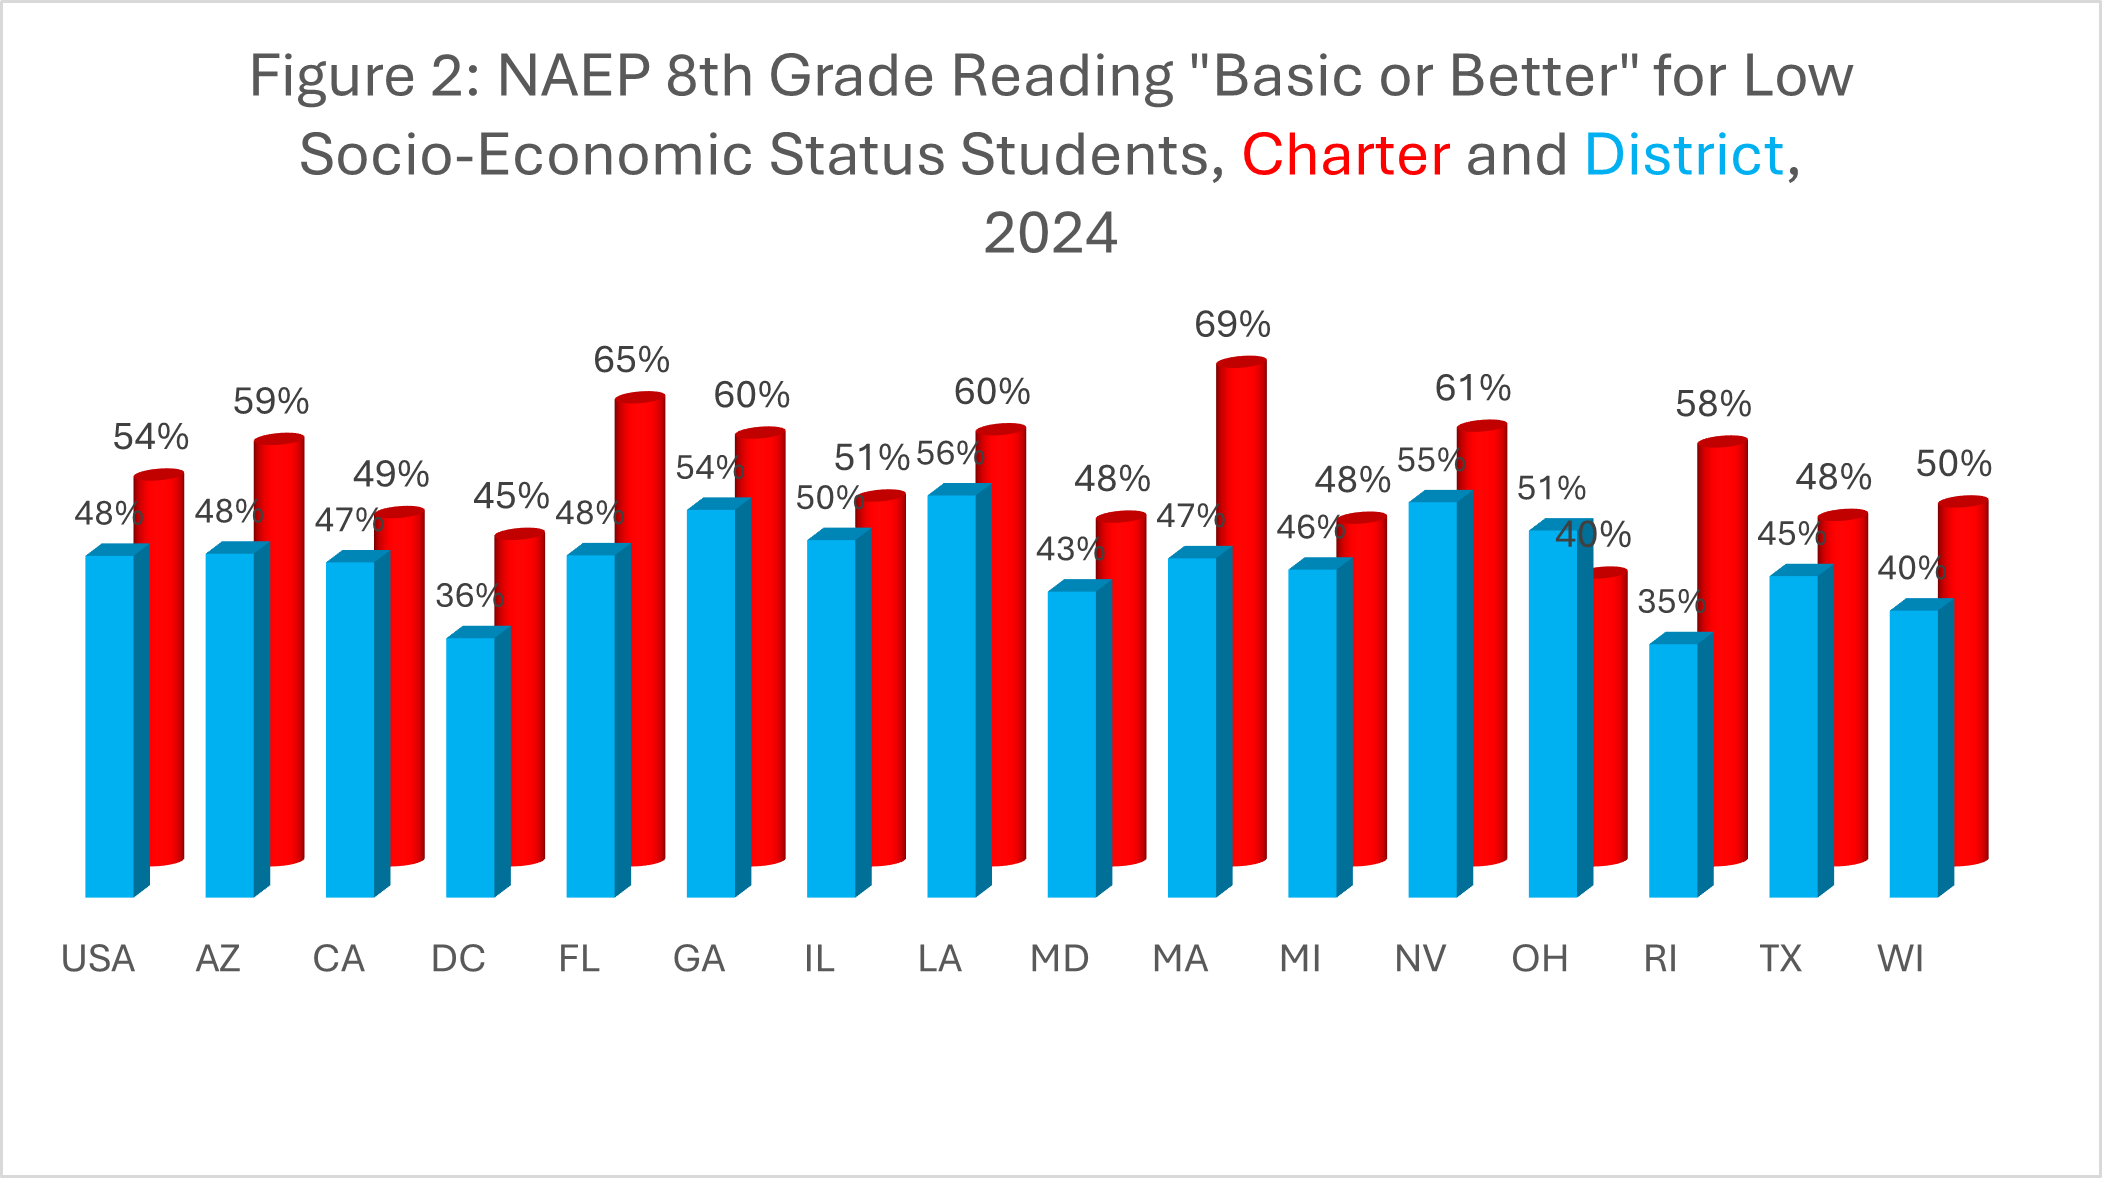
The national difference between charters and districts again registers as statistically significant. I would test the state differences, but the NAEP website moves at a glacial pace, and we have deadlines to meet here at your favorite edublog. More to come, but for now let’s just note that charter schools have largely succeeded on average in producing better academic outcomes with significantly fewer resources.

Authors Daron Acemoglu and James A. Robinson distinguished between “inclusive” and “extractive” institutions in their 2012 book "Why Nations Fail." Inclusive political institutions allow broad political participation and are a precursor to inclusive economic institutions, which broadly protect individual property rights and provide incentives for workers to increase labor productivity. By contrast, Acemoglu and Robinson define extractive economic institutions as excluding large segments of the population from the distribution of income from their own activities. Extractive economic institutions benefit only elites.
Slavery would clearly qualify as extractive, but other institutions contain mixed elements. Public education systems can be thought of as falling on a spectrum between extractive and inclusive. All public education systems use involuntary taxation, which is extractive. Public education also allows for universal participation for school age children, which is inclusive.
To the extent that public education systems broadly equip students with the knowledge, skill and habits required for success, they are more inclusive. If, however, an institution provides such outcomes only to a subset of elite students, they become more exclusive. The extent that electoral participation in public education systems is broad, it is inclusive, to the extent that it is narrow, it becomes less inclusive. International examinations of student achievement have disappointing results for American students. Among countries that spend at least half as much per pupil as the United States (29 countries), America scored below all but one (see Figure 1) below.

We can judge the relative inclusivity of the American education system by seeing how our low-income children compare to low-income children in countries spending at least half of what the United States spends per pupil. Scores by family income data are available in the 2022 PISA exam, displayed in Figure 2 below.
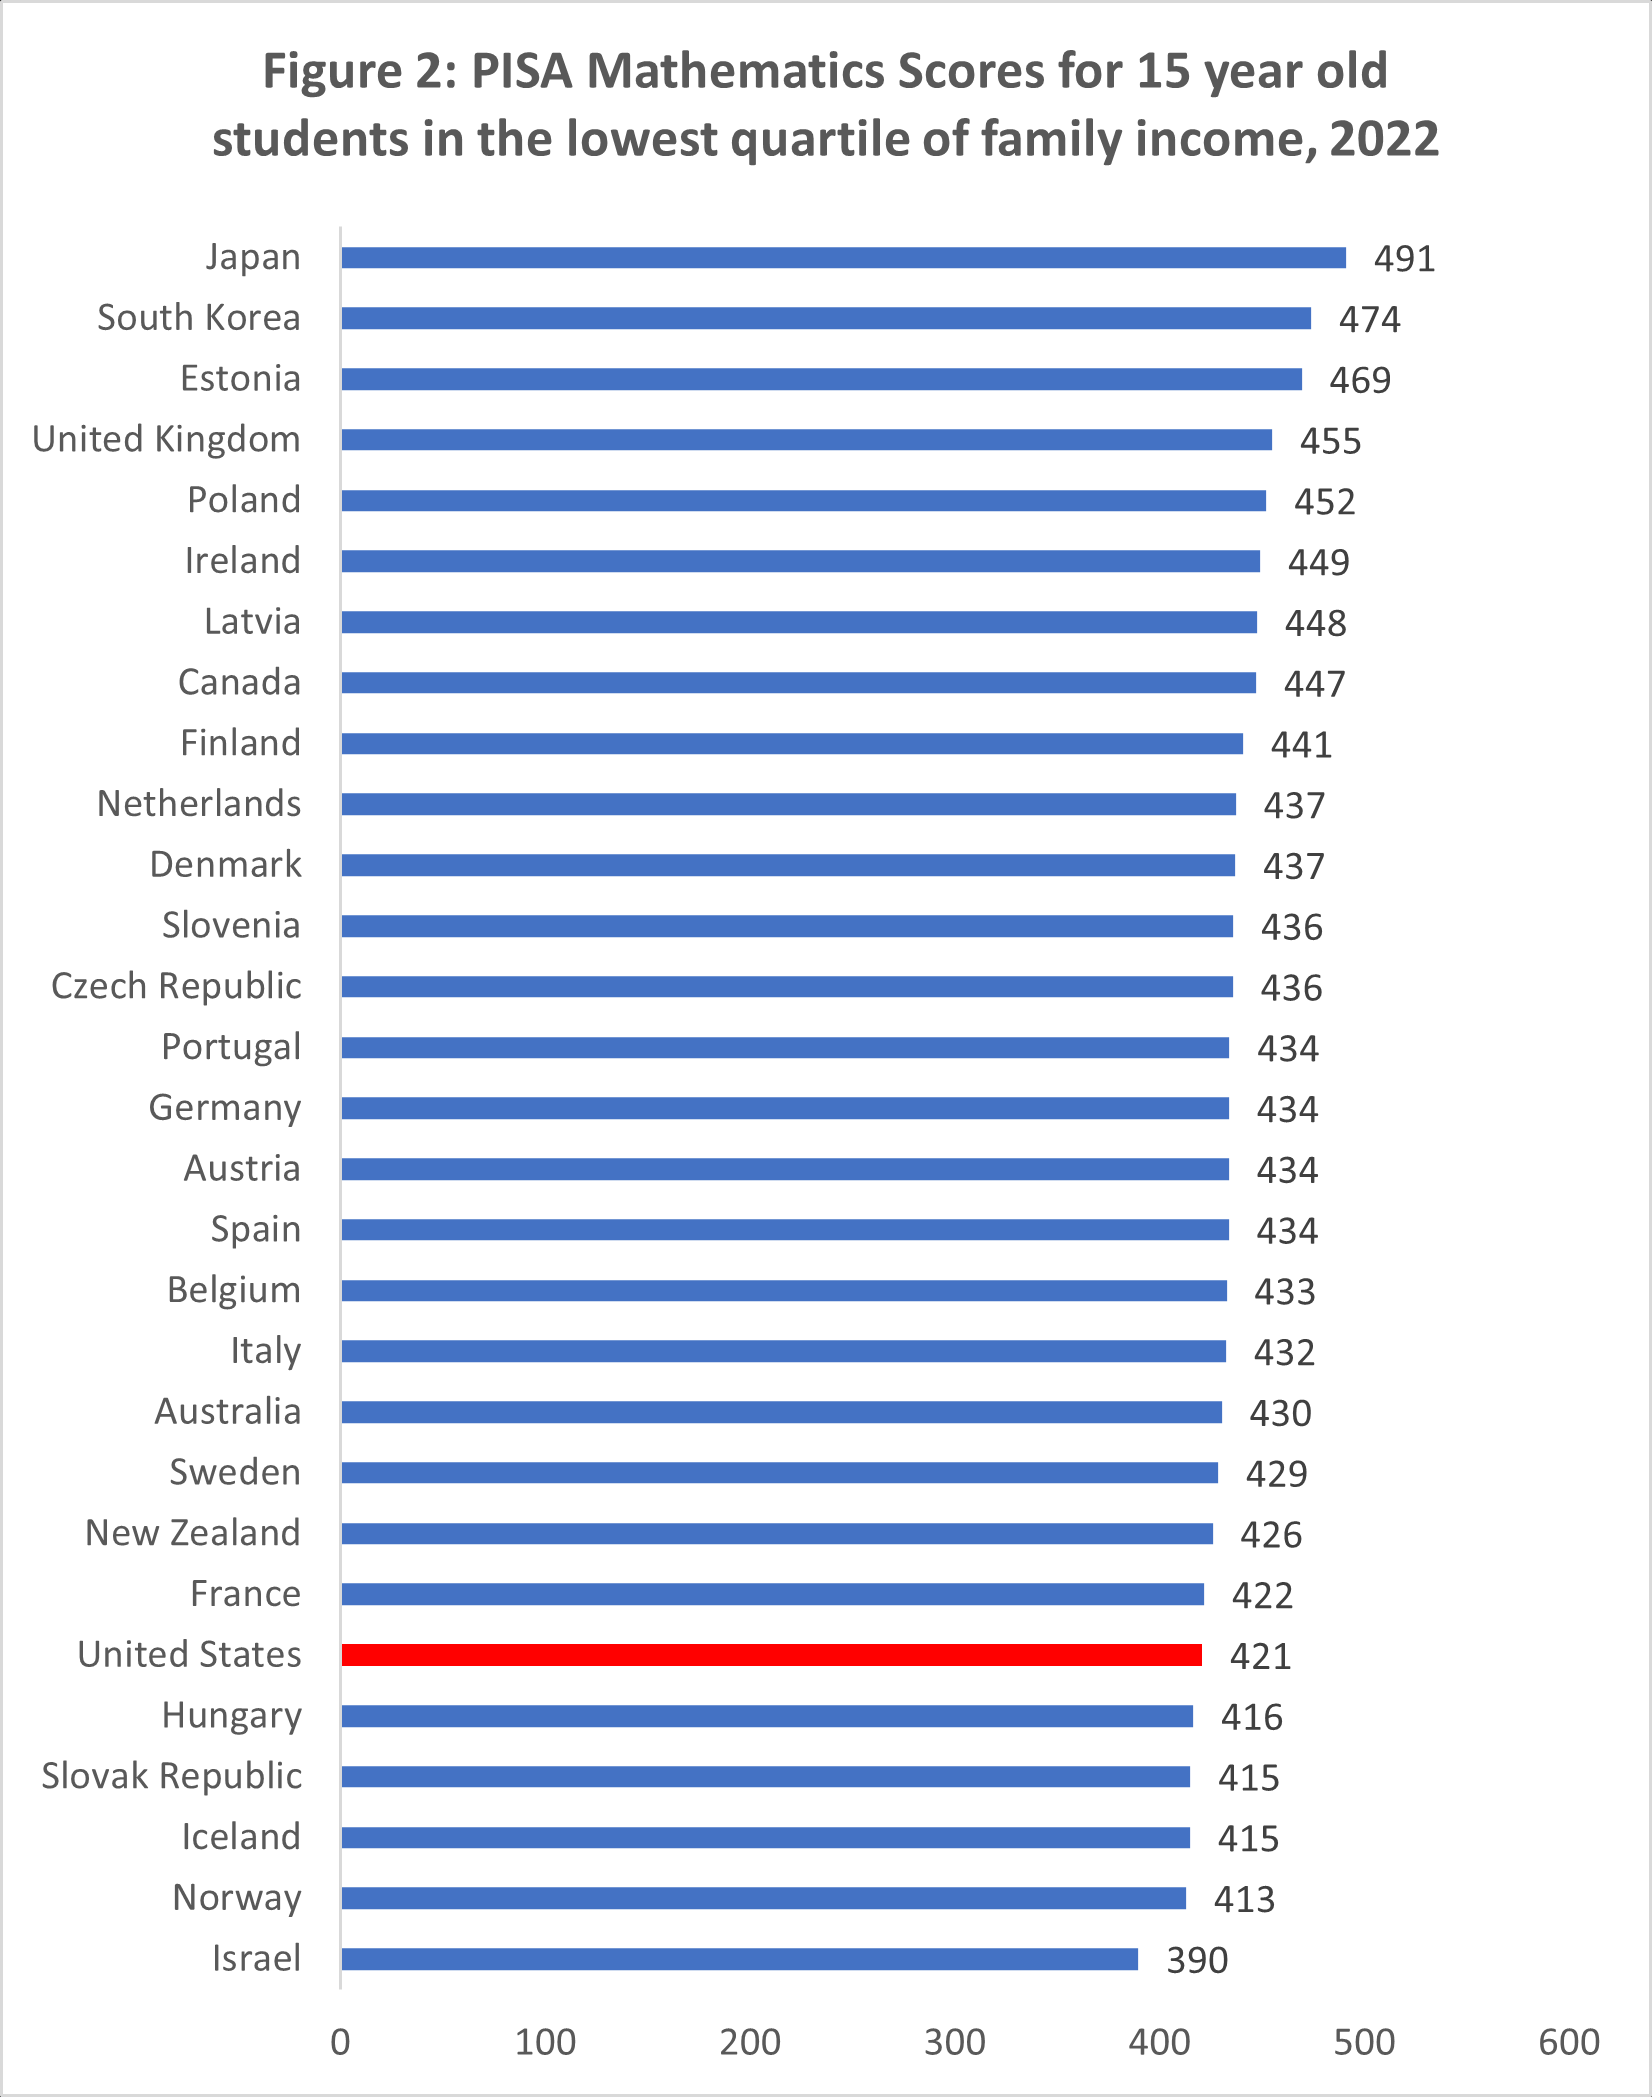
America’s poor students ranking low sadly does not surprise. What may be surprising is the fact that the poorest students in Japan scored 491 in 2022, which was higher than the average American student in 2018. Despite the 2022 test reflecting the impact of the COVID-19 pandemic and despite Japan spending approximately 40% less per pupil than the average in the United States, poor Japanese students outscored the average American student from 2018.
The United States has a costly, inefficient and relatively extractive system of public education. If you are curious about who the extractive elites benefiting from the status quo might be, simply observe who fights to preserve the system. We can’t be sure why American schools are so extractive and ineffective. Combining ZIP code assignment with regulatory capture and layering on a Rube Goldberg machine of state and federal regulation appears deeply suboptimal.

“Sweet are the uses of adversity,
Which, like the toad, ugly and venomous,
Wears yet a precious jewel in his head;
And this our life, exempt from public haunt,
Find tongues in trees, books in the running brooks,
Sermons in stones, and good in everything.”
— William Shakespeare, “As You Like It”
Arizona students led the nation in improvement on NAEP between 2009 and 2015. During this period, Arizona students uniquely made statistically significant improvements on all six NAEP exams (fourth and eighth grade reading, mathematics and science). When your author stumbled upon the Stanford Educational Opportunity Project data, it found that Arizona students had the fastest rate of academic growth between 2008 and 2018. This improvement did not last, but it may be coming back.
Fast forward from these happy times to the 2024 NAEP and the improvement era is looking like a lost golden age. While Arizona’s charter schools show clear signs of academic recovery, Arizona’s school districts are a hot mess. For example, in eighth grade math the average Arizona charter student was comfortably a grade level ahead of the national average for district students, whereas Arizona district students were embarrassingly a grade level behind the average for district students, and approximately two grade levels behind Arizona charter students:

Oooof. What happened?
Well one can never be certain about the relationships between policy and outcomes, but here is your humble author’s working theory. First off, Arizona’s top-down accountability system is a joke. We grade schools A-F, but the formula makes no sense and hands out approximately 120 “A” grades for every “F” grade. Our lawmakers also passed a third grade retention law years ago, but the Arizona State Board of Education has seen to it that effectively no one gets retained. “Accountability” of the testing sort is approximately as firm as a soft-serve ice cream cone that has been sitting out in the Phoenix heat.
It is not as though it used to make sense/have some firmness to it: these policies have sadly never been either firm and/or made much sense, best I can tell. It used to not matter, however, because choice served as the de-facto accountability system.
During the 2009-2015 period, Arizona charter school enrollment surged as high-demand operators were able to access inexpensive property during the Great Recession. Arizona lawmakers expanded the state’s scholarship tax credit programs, and then created the nation’s first ESA program, which started small but steadily grew.
All of this triggered a virtuous cycle during the housing bust aftermath. High demand districts, even fancy ones like Scottsdale Unified, became increasingly open to and aggressive about open enrollment. Open enrollment remains the largest form of choice in Arizona. The financial impact of students transferring between schools and districts mirrors that of other forms of choice, with the state funding following the child. The ready availability of seats in high demand districts spurred a positive feedback loop into the charter school sector whereby high demand charter schools replicated and expanded, but low demand charter schools closed. Not many district schools closed, but many felt the pinch of lowering enrollment. Statewide academic achievement, as noted above, surged; the uses of our Great Recession induced adversity proved to be sweet.
So, what went wrong during the COVID-19 adversity? Basically, the influx of federal COVID relief funding turned off competitive effects, which left us solely reliant on our top-down accountability system, which is ineffectual to say the least.
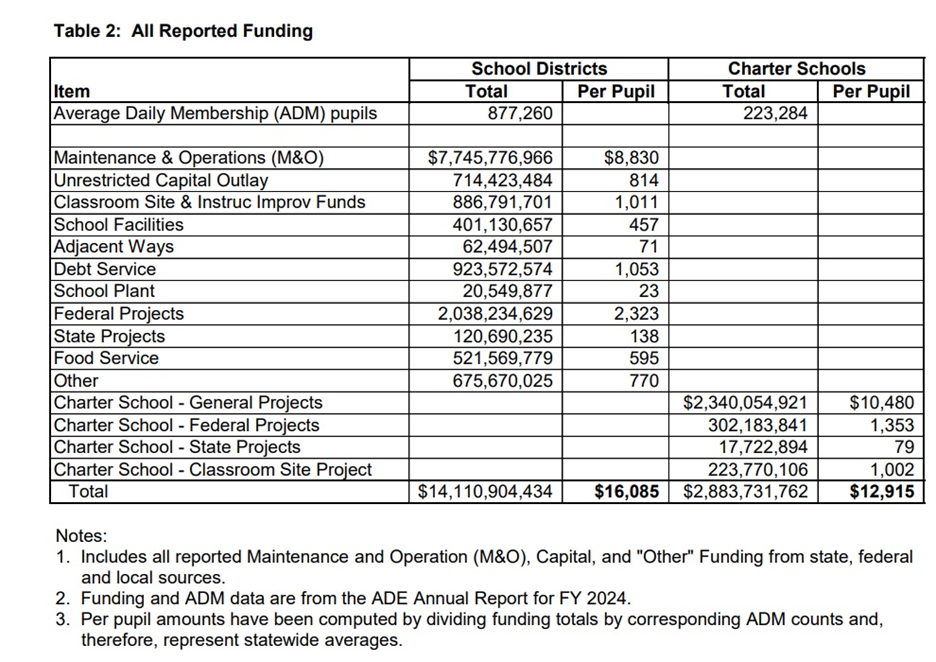
Why did competitive effects go away? Between the 2019-20 school year and the 2022-23 school year, Arizona school district enrollment dropped by 5%. Arizona school district total revenue, however, increased by 36 percent (see page 3). Arizona school districts received more money to (mis)educate fewer students — not exactly a recipe for competitive pressure. Quite the opposite, actually. Arizona charters meanwhile get less money per pupil, and unlike Arizona districts, show signs of recovery in the NAEP:
Can Arizona regain the lost mojo? Possibly. The federal funny money is washing out of the system, meaning that competitive pressure will return. The advent of the Baby Bust in 2008 means that there are fewer students to go around despite the state’s growing overall population. Arizona has some very talented and competitive people working in school districts, and the competition knob is about to get turned to “11.”
Stay tuned to this channel to see what happens next.
Pope Francis opened the Holy Door of St. Peter's Basilica on Dec. 24 to mark the beginning of the 2025 Jubilee Year of Hope. He has called Catholics to be “pilgrims of hope” and pursue special acts of penance and mercy.
If hope will be a special theme for Catholics across the globe, it’s fitting that our schools can serve as beacons of hope for an American education system mired in sinking outcomes and rising inequality.
In a round of testing that brought bad news for most students across the country, Catholic school students scored one to two grade levels higher than their public school peers. While the comparison from public and Catholic cannot be broken down at the state level, the national data shows Catholic school students outperforming their peers.
The National Catholic Education Association (NCEA) reports that if Catholic schools were a state, they would rank first in NAEP scale scores for grades four and eight in math and reading.

Chart by Marc Porter Magee
Just as Pope Francis opened a door to symbolize hope, Catholic schools in Florida and Iowa are opening their doors to more students. According to enrollment data recently released by the Florida Catholic, our state’s Catholic schools grew by 2.8% this year. The number of students using a state scholarship to attend also increased. A NextSteps special report showed Florida Catholic schools not only survived but thrived between 2013 and 2023, posting 4.4% in enrollment during that span.
Scholarships open the door for families that may not have been able to afford Catholic school tuition. In Iowa Catholic schools, growth is accelerating. They report a 4% enrollment increase, now serving 25,264 students. National Catholic school enrollment numbers will be released in the coming months by the NCEA.
Pope Francis said, "Hope dwells as the desire and expectation of good things to come."
Opportunity brings hope to those who need it most. Students using a scholarship for unique abilities in Florida’s Catholic schools increased by 36% year-over-year. Catholic schools are finding new ways to serve unique populations while maintaining a steadfast commitment to academic excellence.
The recent NAEP scores and enrollment data from states with strong commitments to empowering parents to select the best schools for their children give hope for many.
The NAEP released 2024 results last week, and the results continued to disappoint, especially for disadvantaged student groups. While scores began to recover among high end performers, the decline continued among lower performers, as can be seen in the eighth grade math chart below:

Rick Hess summarized the bad news:
Fourth- and 8th-grade reading scores declined again. Between 2019 and 2024, 4th-grade reading is down (significantly or otherwise) in every state but Louisiana and Alabama. Among 8th graders, fewer than one-in-three students were “proficient” readers. Thirty-three percent were “below basic.”
 On fourth grade reading, note the gradual improvement across racial subgroups from 2003 to 2015, but then the backsliding since then across groups. Critically, the slide started before the COVID-19 pandemic (the 2017 and 2019 exams both occurred before the outbreak). The decline between 2022 and 2024 is especially disappointing.
This continued slide occurred despite the federal government putting $190 billion into the school system. The 2024 NAEP was the second post-pandemic data collection (after 2022). With a sad predictability, the return on investment for this staggering funding appears to be minimal.

The defacto “plan” in the public school system appears to be to age the students out of the system unremediated. The 2026 fourth grade NAEP, for example, will be testing students largely too young to have been enrolled during the 2019-2020 school years. The eighth grade NAEP will take longer to age the pandemic fiasco-affected students out, but this will eventually happen as well. The affected students, however, will be aging not out of the elementary and middle schools but into society.
The news was not all grim: nationwide Catholic school students show signs of academic recovery. Unfortunately, the Catholic results are the only private school scores available, but they show a notably different trend than those in the public school system. See for example the trend among Hispanic students in Catholic schools and public school students on eighth grade mathematics:

The gap between Hispanic students attending Catholic schools has effectively moved from approximately a grade level, to approximately two grade levels in 2024. Louisiana was also a bright spot in the 2024 results. More number crunching to follow, but what I am finding thus far is the closer you look, the worse the results seem.
For years, Florida’s online schools have grappled with a logistical challenge: Getting their students to the campuses of brick-and-mortar schools, operated by school districts, to take their standardized tests.
Kevin Chavous, the president of the online learning company Stride, laid out the complications several years ago:
Imagine that a school district notifies parents that they must take their child to a location 60 miles from home for testing. Transportation will not be provided; parents are responsible for ensuring that their children arrive every day at their assigned testing site for up to a week, until all exams are complete. Families with multiple children may need to travel every day for two or three consecutive weeks, depending on the kids’ grade levels and the tests they must take. This may require making hotel arrangements and requesting leave from employers to ensure their child is present each day.
This scenario is, of course, absurd and would never happen in a regular school district. Yet it is reality for students in full-time, statewide online public schools.
One consequence of these and other mundane hurdles has been a raft of “incomplete” A-F grades whenever the state releases its annual school accountability reports.
For the 2022-23 school year, 20 of the 32 public schools that received incomplete grades were online learning institutions. The previous year, online schools accounted for 29 of 40 incompletes.
Virtual students have a harder time showing up for assessments proctored in person, or even knowing where to go or whom to ask. As a result, online schools are more likely to have fewer than 95% of their eligible students submitting test results, which can lead to an incomplete letter grade.
New legislation passed this year could help. A provision of HB 1285, a wide-ranging education bill, would set specific expectations for districts and online schools:
It is the responsibility of the approved virtual instruction program provider or virtual charter school to provide a list of students to be administered statewide assessments and progress monitoring to the school district, including the students' names, Florida Education Identifiers, grade levels, assessments and progress monitoring to be administered, and contact information. Unless an alternative testing site is mutually agreed to by the approved virtual instruction program provider or virtual charter school and the school district, or as specified in the contract under s. 1008.24, all assessments and progress monitoring must be taken at the school to which the student would be assigned according to district school board attendance policies. A school district must provide the student with access to the school's or district's testing facilities and provide the student with the date and time of the administration of each assessment and progress monitoring.
That might not fix all the logistical hassles described by Chavous, but it could help iron out some more run-of-the-mill coordination challenges with getting virtual students into physical campuses for testing.
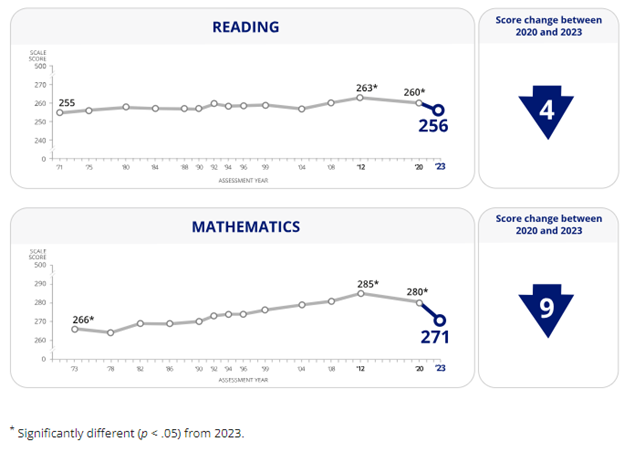
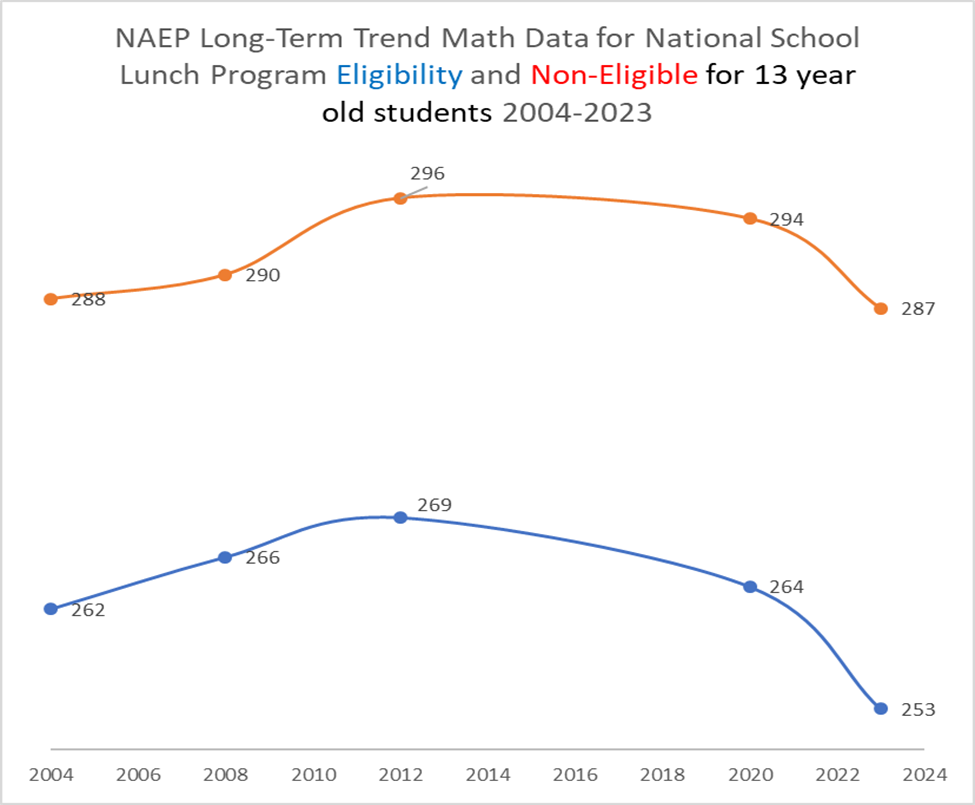
The National Assessment of Educational Progress released Long Term Trend data for 13-year-old students last week. On these exams, 10 points approximately equals a grade level worth of average academic progress. Mathematics achievement has dropped 14 points and reading seven points since 2012. The COVID-19 pandemic accelerated a pre-existing decline. Real spending per student was 160% higher in 2019-20 than in 1969-70, but reading scores are statistically identical (255 in 1970, 256 in 2023). Since 2019, spending has gone to record highs while achievement to near record lows.
The news gets worse when you examine achievement gaps. The chart below shows the mathematics trend by free or reduced lunch eligibility status. The smallest gap stood at a still appalling 24 points in 2008. In 2023 the gap stood at 34 points, the largest on record.
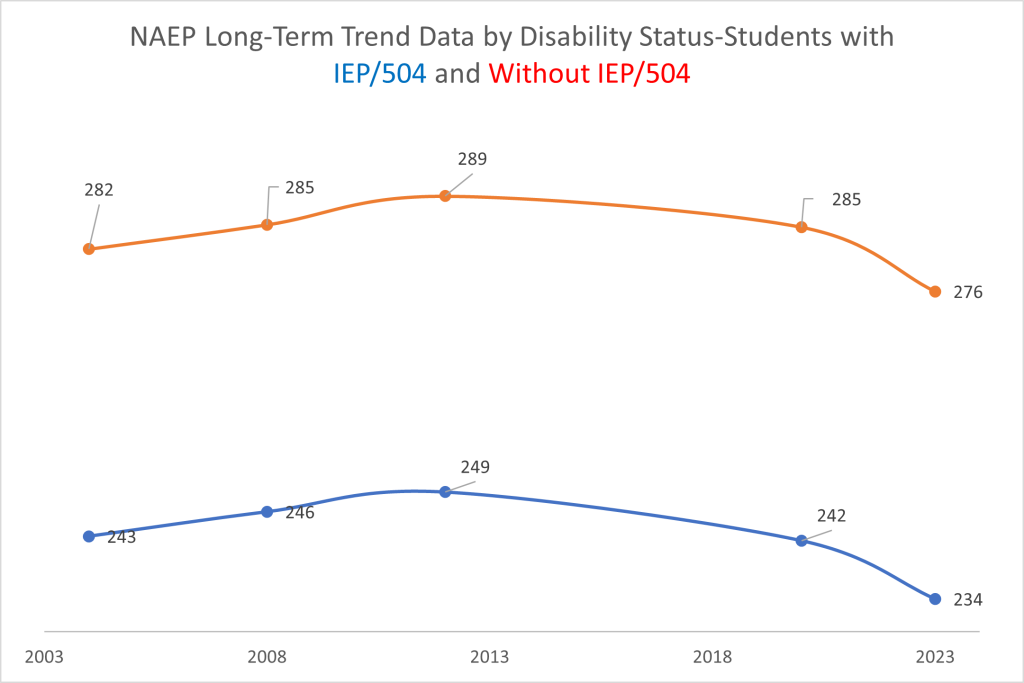
Similar story by disability status- bad for both, worst for IEP/504 plan students.
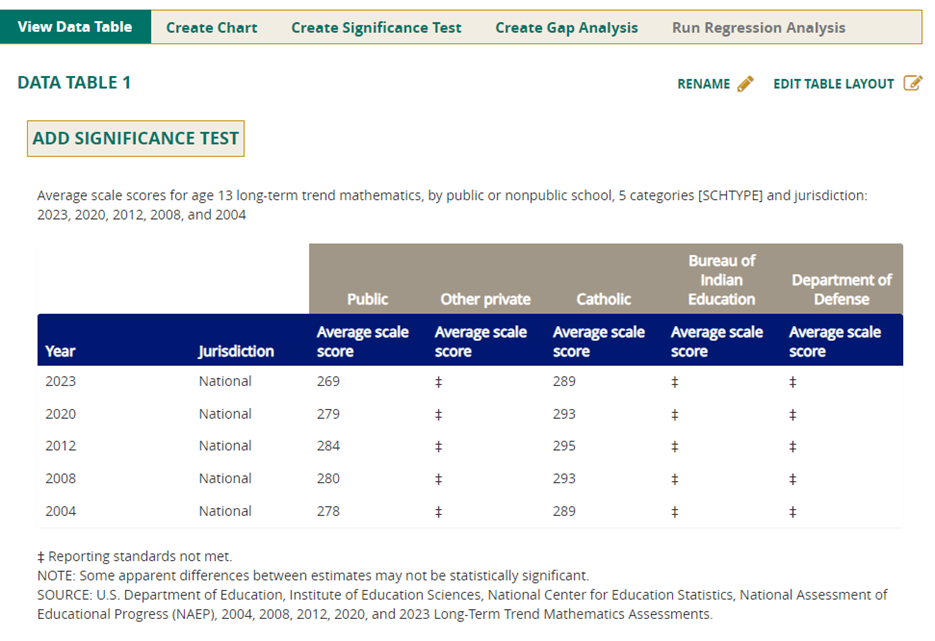
The gap between public school and Catholic school students increased from 11 points in favor of Catholic school students in 2004 to a 20-point advantage in 2023. The advantage for Hispanic students in Catholic schools stood at 23 points higher than their public-school peers.
Now it could be that you are not overly concerned about your child or grandchild learning civics, mathematics or reading. If so the union captured district system has growing numbers of empty seats just for you! As an added bonus, your special little ones can indirectly serve as funding units for some of the most reactionary special interests in American politics today!
Not your particular cup of tea? Well then consider making alternate plans. Millions before you have already done so, and the flight to freedom is just getting warmed up.