

![]() The performance of American public schools was in decline before the pandemic struck; based on the latest results from the National Assessment of Educational Progress released Wednesday by the National Center for Education Statistics, things are likely to only get worse from here.
The performance of American public schools was in decline before the pandemic struck; based on the latest results from the National Assessment of Educational Progress released Wednesday by the National Center for Education Statistics, things are likely to only get worse from here.
The data show the average reading score for the nation’s 12th-graders declined between 2015 and 2019. Meanwhile, there was no statistically significant change in 12th-graders’ average mathematics score for the same time period.
Bottom line: considerably more money per pupil was spent to get the same not-so-great results.
The tests upon which the data is based were given in spring 2019, before the COVID-19 pandemic. The indications are now worse: Inflation-adjusted spending per pupil is up, childhood poverty is down, and scores are down rather than flat.
The earliest 12th-grade reading score in this series comes from 1992. The Class of 1992 benefited from a nationwide average of $105,560 in 2018 constant dollars spent on their K-12 education. The Class of 2017, the cohort from which we have the most recently available data, had a nationwide average of $158,431 in constant dollars spent on their education – approximately 50% more. The figure for the Class of 2019 will be even higher.
Which class, 1992 or 2017, demonstrated better reading ability? Let’s break down the results by parental education.
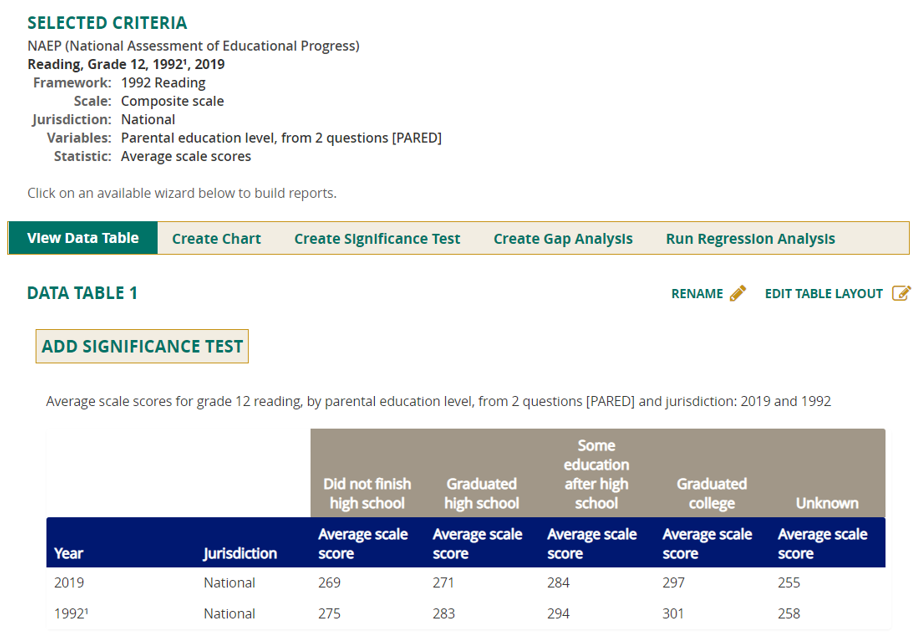
Regardless of the level of a parent’s education, reading scores were lower for the Class of 2019 than the Class of 1992. All of the above differences are statistically significant.
Now take a look at the chart below, provided by Michael J. Petrilli from the Thomas B. Fordham Institute, showing the decline in childhood poverty rates from the 1980s and 1990s.
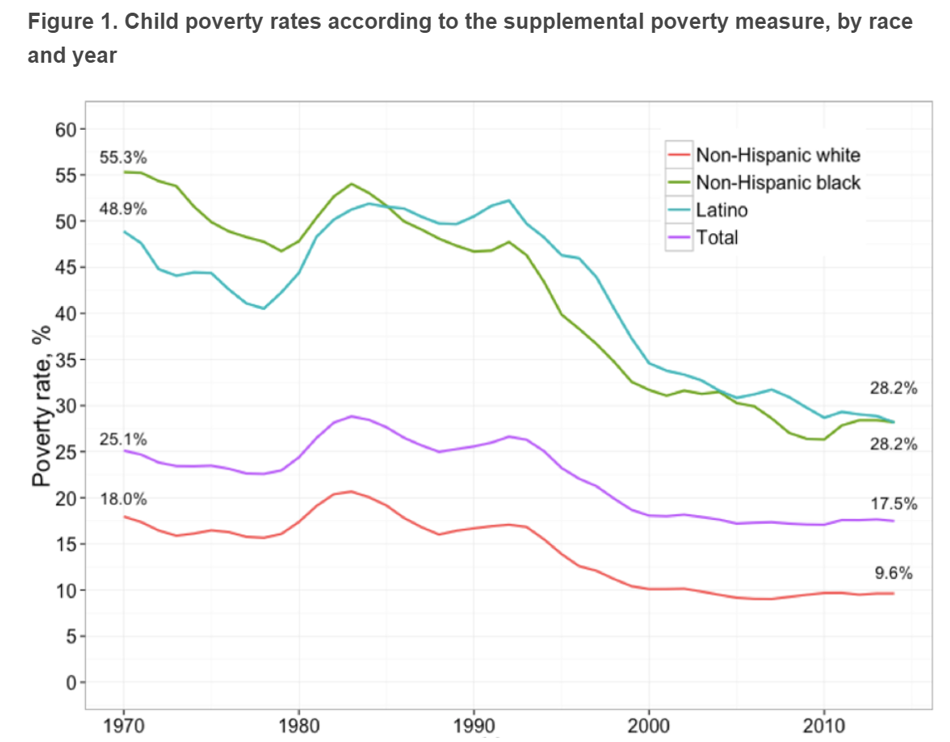
What the chart shows: higher spending, less poverty and lower national achievement.
Mind you, this was the trend before the current massive decline in instruction time due to the pandemic. I’ll dare to predict that if the NCES manages to conduct the scheduled 2021 NAEP, exams scores will decline across the board and achievement gaps will grow. K-3 kids who are in their literacy acquisition windows, for instance, in districts like Los Angeles Unified, Clark County Nevada and New York have been receiving less than half the amount of instruction time delivered during a normal school year.
And finally, special education trends were a disaster in many states before the pandemic, as detailed in this chart.
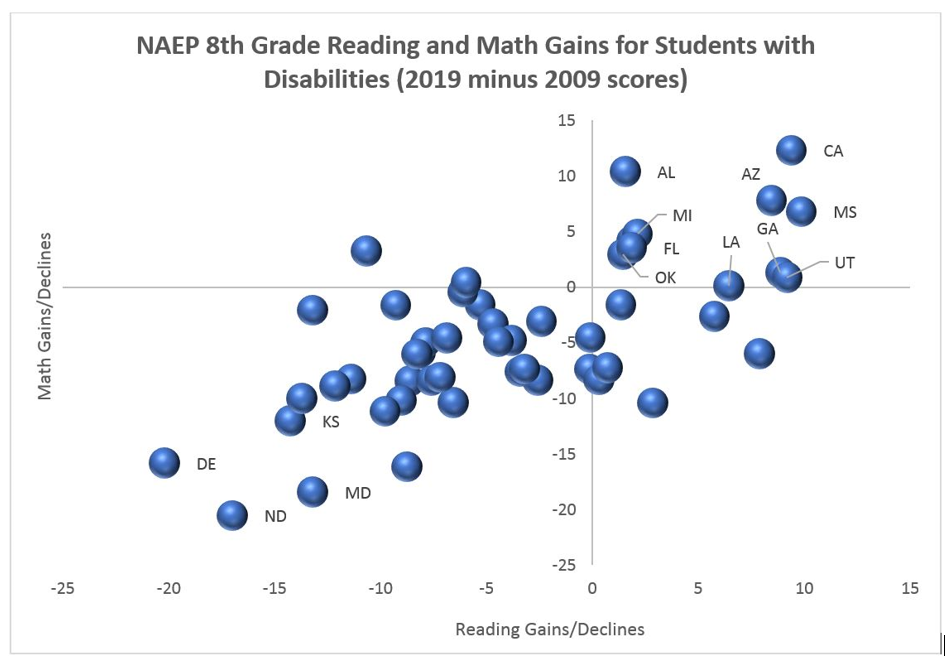
It’s difficult to imagine that this already dismal chart won’t look even worse with 2021 data, coming in the aftermath of generally reduced instruction time and special education being attempted using the Zoom platform. We are not out of the pandemic yet, but the academic damage seems likely to greatly outlive the virus.
These most recent data came among favorable conditions of declining poverty and increased spending. Very soon, we’ll be forced to face what happens when you reverse these favorable trends and we end up with a large percentage of students with huge academic deficits.
Buckle up.