
 The Manhattan Institute published a study by Jay Greene in 2001 called the Education Freedom Index, which created a state-by-state comparison featuring measures of state charter school sectors, private choice, homeschooling and ease of transfer between districts. The study found a positive correlation between a state’s Education Freedom Index and academic performance.
Some 20 years later, I had the opportunity to work with Greene and his associates Patrick J. Wolf and James D. Paul to update the index. What we see are some big moves up and down the list, one consistent leader, and, once again, a positive correlation between the index and academic performance.
The rankings in both 2000 and 2021 are presented in this graphic:
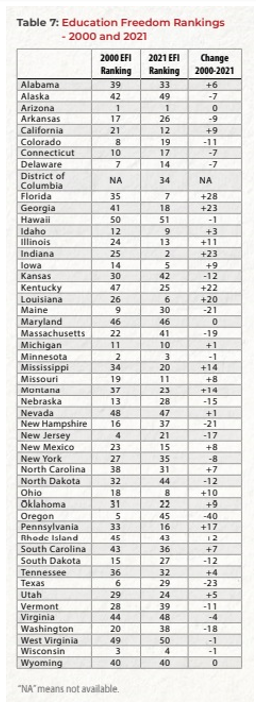 A few things to note: A great deal has changed since 2000. Arizona ranked No. 1 in 2000 based on a liberal and growing charter school sector and the early stirrings of private choice. A state with the amount of choice exercised in the Arizona of 2001, however, probably would rank as middling in the 2021 rankings. While Arizona ranked first in 2001 and first in 2021, the amount of choice being exercised by Arizona families today is far greater than it was in 2001.
A recent release of data from the Stanford Opportunity project found Arizona students had the highest rate of academic growth both overall and for low-income students between 2007 and 2018. The predictions of doom which routinely accompanied each expansion of choice in Arizona are impossible to square with Arizona’s actual record of improvement.
Florida gained more than any other state in the rankings, moving from 35th in 2001 to 7th in 2021. We can’t firmly understand the relationship between education policy and outcomes, the lags such policies have before influencing outcomes, and associated mysteries. Life doesn’t often happen in a random assignment study, after all.
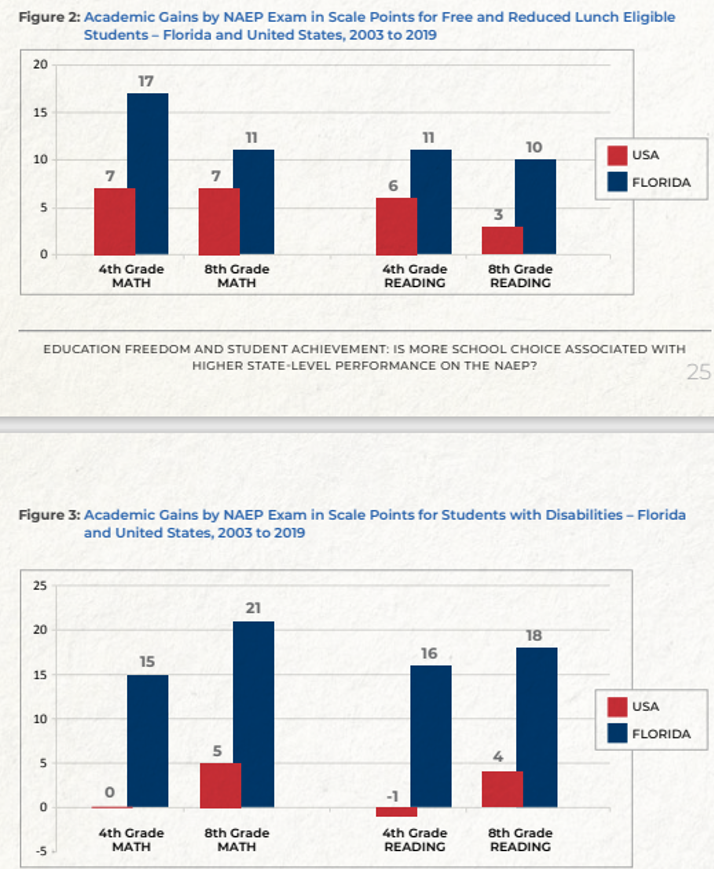
The two student populations with the most choice in Florida during the period between the studies – low-income students and students with disabilities – show the outsized progress on NAEP compared to the national average.
 Check out the study, judge for yourself, live long and prosper.

If the nation’s 12th-grade NAEP scores don’t move, these earlier gains are pretty useless, since they fade out by the time these young adults enter the working world. Even more disturbing is that 12th-grade achievement on NAEP in the United States is set at such a narrow, low level, which studies like this valorize: just two subjects are assessed, rather than the six for the International Baccalaureate Diploma, eight for measuring progress in England, and ten for its European counterpart, with American mathematics grade level achievement set 2-3 years below that established in East Asia: falsely justified self-satisfaction is being purveyed here.
Bruce-
I can’t say I share your confidence regarding how to interpret achievement data. NAEP doesn’t collect 12th grade data by state often, and how to interpret it if it did would be the subject of some debate. For example the high school graduation rate in Florida in 1999 was all of 52%. If there was a NAEP measuring 12th grade achievement in 1999 how comparable would we imagine it to be to one in 2019 say when the high school graduation rate was 90%? If one sees a state like Florida where 4th and 8th grade NAEP scores have improved, high school graduation rates have improved, college attendance has improved and college graduation has improved, that is not satisfaction but rather simply a notation of improvement. Better results doesn’t mean that they are good enough, merely that they are better than they were in the past.