
 Editor’s note: This analysis from Patrick Gibbons, manager for Policy and Public Affairs at Step Up For Students, is the second in a two-part series. You can read Part 1 here.
Earlier this month, the Southern Poverty Law Center, Education Law Center, Public School Funds, and the National Center for the Study of Privatization in Education teamed up to publish a report titled “The Fiscal Consequences of Private School Vouchers.”
The report concludes that vouchers have resulted in a decline in per-pupil funding to K-12 schools in the states where vouchers are active.
The analysis makes several flawed assumptions to reach those conclusions:
- The fiscal analysis begins in 2008, the all-time per-pupil high for many states.
- The researchers invent their own per-pupil spending calculation amount that removes federal revenues, unfairly impacting poorer states that are more likely to have school vouchers.
- The researchers define PK-12 funding as a percentage of the state’s Gross Domestic Product, a definition so useless a state could literally improve its ranking simply by becoming more poor rather than spending more.
The SPLC report states “the decline in per-pupil funding in Florida cannot be attributed to economic duress.” The report blames vouchers instead.
Perhaps the SPLC forgot about the housing market crash.
Like many states, Florida uses property taxes to help fund K-12 education. Florida’s red-hot housing market popped in 2006 with a global housing market crash. Despite the bankruptcies and collapsing housing values, Florida’s K-12 school system saw record-high per pupil spending in 2008.
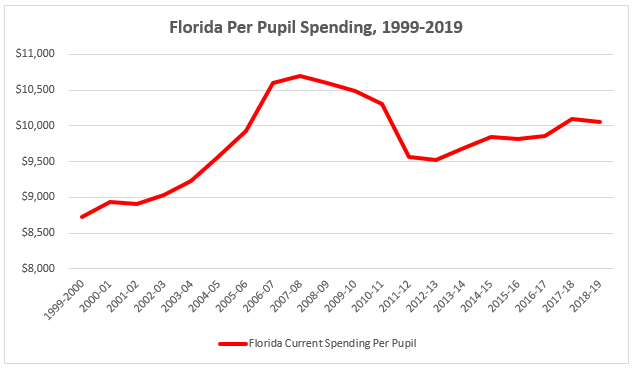
*Data from the U.S. Department of Education’s Digest of Education Statistics and adjusted
to 2020 dollar values with the U.S. Bureau of Labor Statistics inflation calculator
After several years of inflated spending, it was clear those levels were not sustainable. Per-pupil funding then declined to the same inflation-adjusted amount as in 2006.
Worse still, Florida’s first voucher came about in 1999 with fewer than 100 students. Today, there are more than 250,000 tax credit scholarship, voucher, and education savings account students in the state. Despite this, public school funding is actually up $1,331 per pupil since 1999-2000.
If that was not enough damage to the SLPC argument that vouchers, not economic challenges, are to blame, consider the fact that Florida’s per capita income cratered and never recovered as of 2019.
Per capita real Gross Domestic Product of Florida 2008-2019
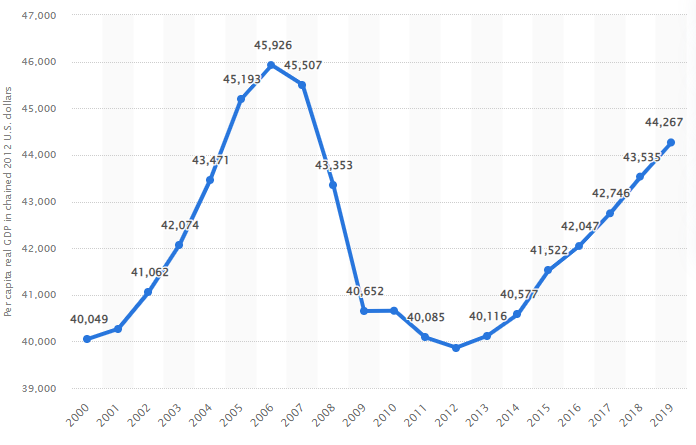
*Source: Florida: per capita real GDP 2000-2019 | Statista
It’s also worth noting the SLPC’s and Education Law Center’s obsession with “spending effort” – which is really just spending as a percentage of the state’s gross domestic product – is useless.
Imagine defining your personal housing success as increasing your housing expenses as fast or faster than your wages, regardless of whether the quality of your housing actually improved.
In fact, there doesn’t appear to be any correlation with “spending effort” and education quality as defined by the most recent Education Week’s Quality Count’s K-12 Achievement rankings.
States in the Top 10 for “spending effort” spent $18,169 per pupil on average and averaged a C-minus with a score of 72.43 on Education Week’s achievement ranking.
States in the Bottom 10 for “spending effort” spent $9,871 per pupil and averaged a C-minus with a score of 73.14.
Those high-effort states spend twice as much to get roughly the same result (albeit ever so slightly worse).